The Hartford 2009 Annual Report Download - page 56
Download and view the complete annual report
Please find page 56 of the 2009 The Hartford annual report below. You can navigate through the pages in the report by either clicking on the pages listed below, or by using the keyword search tool below to find specific information within the annual report.-
 1
1 -
2
-
3
-
4
-
5
-
6
-
7
-
8
-
9
-
10
-
11
-
12
-
13
-
14
-
15
-
16
-
17
-
18
-
19
-
20
-
21
-
22
-
23
-
24
-
25
-
26
-
27
-
28
-
29
-
30
-
31
-
32
-
33
-
34
-
35
-
36
-
37
-
38
-
39
-
40
-
41
-
42
-
43
-
44
-
45
-
 46
46 -
 47
47 -
 48
48 -
 49
49 -
 50
50 -
 51
51 -
 52
52 -
 53
53 -
 54
54 -
 55
55 -
 56
56 -
 57
57 -
 58
58 -
 59
59 -
 60
60 -
 61
61 -
 62
62 -
 63
63 -
 64
64 -
 65
65 -
 66
66 -
67
-
68
-
69
-
70
-
71
-
72
-
73
-
74
-
75
-
76
-
77
-
78
-
79
-
80
-
81
-
82
-
83
-
84
-
85
-
86
-
87
-
88
-
89
-
90
-
91
-
92
-
93
-
94
-
95
-
96
-
97
-
98
-
99
-
100
-
101
-
102
-
103
-
104
-
105
-
106
-
107
-
108
-
109
-
110
-
111
-
112
-
113
-
114
-
115
-
116
-
117
-
118
-
119
-
120
-
121
-
122
-
123
-
124
-
125
-
126
-
127
-
128
-
129
-
130
-
131
-
132
-
133
-
134
-
135
-
136
-
137
-
138
-
139
-
140
-
141
-
142
-
143
-
144
-
145
-
146
-
147
-
148
-
149
-
150
-
151
-
152
-
153
-
154
-
155
-
156
-
157
-
158
-
159
-
160
-
161
-
162
-
163
-
164
-
165
-
166
-
167
-
168
-
169
-
170
-
171
-
172
-
173
-
174
-
175
-
176
-
177
-
178
-
179
-
180
-
181
-
182
-
183
-
184
-
185
-
186
-
187
-
188
-
189
-
190
-
191
-
192
-
193
-
194
-
195
-
196
-
197
-
198
-
199
-
200
-
201
-
202
-
203
-
204
-
205
-
206
-
207
-
208
-
209
-
210
-
211
-
212
-
213
-
214
-
215
-
216
-
217
-
218
-
219
-
220
-
221
-
222
-
223
-
224
-
225
-
226
-
227
-
228
-
229
-
230
-
231
-
232
-
233
-
234
-
235
-
236
-
237
-
238
-
239
-
240
-
241
-
242
-
243
-
244
-
245
-
246
-
247
-
248
-
249
-
250
-
251
-
252
-
253
-
254
-
255
-
256
-
257
-
258
-
259
-
260
-
261
-
262
-
263
-
264
-
265
-
266
-
267
 |
 |

56
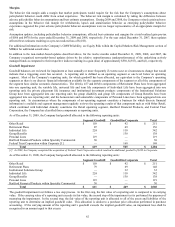
Of the three categories of claims (Direct, Assumed Reinsurance and London Market), direct policies tend to have the greatest factual
development from which to estimate the Company’ s exposures.
Assumed reinsurance exposures are inherently less predictable than direct insurance exposures because the Company may not receive
notice of a reinsurance claim until the underlying direct insurance claim is mature. This causes a delay in the receipt of information at
the reinsurer level and adds to the uncertainty of estimating related reserves.
London Market exposures are the most uncertain of the three categories of claims. As a participant in the London Market (comprised of
both Lloyd’ s of London and London Market companies), certain subsidiaries of the Company wrote business on a subscription basis,
with those subsidiaries’ involvement being limited to a relatively small percentage of a total contract placement. Claims are reported,
via a broker, to the “lead” underwriter and, once agreed to, are presented to the following markets for concurrence. This reporting and
claim agreement process makes estimating liabilities for this business the most uncertain of the three categories of claims.
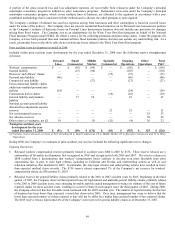
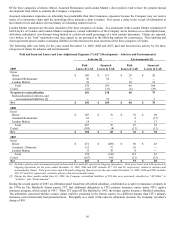
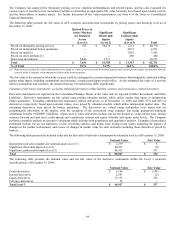
The following table sets forth, for the years ended December 31, 2009, 2008 and 2007, paid and incurred loss activity by the three
categories of claims for asbestos and environmental.
Paid and Incurred Losses and Loss Adjustment Expenses (“LAE”) Development – Asbestos and Environmental
Asbestos [1] Environmental [1]
2009
Paid
Losses & LAE
Incurred
Losses & LAE
Paid
Losses & LAE
Incurred
Losses & LAE
Gross
Direct $ 160 $ 117 $ 29 $ 92
Assumed Reinsurance 56 52 7 —
London Market 18 — 10 12
Total 234 169 46 104
Ceded (53) (31) (6) (29)
Net prior to reclassification 181 138 40 75
Reclassification of asbestos and
environmental liabilities [2]
—
51
—
3
Net $ 181 $ 189 $ 40 $ 78
2008
Gross
Direct $ 207 $ 76 $ 32 $ 69
Assumed Reinsurance 61 — 9 (17)
London Market 19 — 6 13
Total 287 76 47 65
Ceded (105) (8) (11) (11)
Net $ 182 $ 68 $ 36 $ 54
2007
Gross
Direct $ 251 $ (289) $ 90 $ 43
Assumed – Domestic 112 72 16 —
London Market 31 76 8 —
Total 394 (141) 114 43
Ceded (107) 184 (21) (15)
Net $ 287 $ 43 $ 93 $ 28
[1] Excludes asbestos and environmental paid and incurred loss and LAE reported in Ongoing Operations. Total gross losses and LAE incurred in
Ongoing Operations for the years ended December 31, 2009, 2008 and 2007 includes $17, $15 and $9, respectively, related to asbestos and
environmental claims. Total gross losses and LAE paid in Ongoing Operations for the years ended December 31, 2009, 2008 and 2007 includes
$20, $12 and $10, respectively, related to asbestos and environmental claims.
[2] During the three months ended June 30, 2009, the Company reclassified liabilities of $54 that were previously classified as “All Other” to
“Asbestos” and “Environmental”.
During the second quarter of 2007, an arbitration panel found that a Hartford subsidiary, established as a captive reinsurance company in
the 1970s by The Hartford's former parent, ITT, had additional obligations to ITT's primary insurance carrier under ITT's captive
insurance program, which ended in 1993. When ITT spun off The Hartford in 1995, the former captive became a Hartford subsidiary.
The arbitration concerned whether certain claims could be presented to the former captive in a different manner than ITT’ s primary
insurance carrier historically had presented them. Principally as a result of this adverse arbitration decision, the Company recorded a
charge of $99.