The Hartford 2009 Annual Report Download - page 85
Download and view the complete annual report
Please find page 85 of the 2009 The Hartford annual report below. You can navigate through the pages in the report by either clicking on the pages listed below, or by using the keyword search tool below to find specific information within the annual report.-
 1
1 -
2
-
3
-
4
-
5
-
6
-
7
-
8
-
9
-
10
-
11
-
12
-
13
-
14
-
15
-
16
-
17
-
18
-
19
-
20
-
21
-
22
-
23
-
24
-
25
-
26
-
27
-
28
-
29
-
30
-
31
-
32
-
33
-
34
-
35
-
36
-
37
-
38
-
39
-
40
-
41
-
42
-
43
-
44
-
45
-
46
-
47
-
48
-
49
-
50
-
51
-
52
-
53
-
54
-
55
-
56
-
57
-
58
-
59
-
60
-
61
-
62
-
63
-
64
-
65
-
66
-
67
-
68
-
69
-
70
-
71
-
72
-
73
-
74
-
 75
75 -
 76
76 -
 77
77 -
 78
78 -
 79
79 -
 80
80 -
 81
81 -
 82
82 -
 83
83 -
 84
84 -
 85
85 -
 86
86 -
 87
87 -
 88
88 -
 89
89 -
 90
90 -
 91
91 -
 92
92 -
 93
93 -
 94
94 -
 95
95 -
96
-
97
-
98
-
99
-
100
-
101
-
102
-
103
-
104
-
105
-
106
-
107
-
108
-
109
-
110
-
111
-
112
-
113
-
114
-
115
-
116
-
117
-
118
-
119
-
120
-
121
-
122
-
123
-
124
-
125
-
126
-
127
-
128
-
129
-
130
-
131
-
132
-
133
-
134
-
135
-
136
-
137
-
138
-
139
-
140
-
141
-
142
-
143
-
144
-
145
-
146
-
147
-
148
-
149
-
150
-
151
-
152
-
153
-
154
-
155
-
156
-
157
-
158
-
159
-
160
-
161
-
162
-
163
-
164
-
165
-
166
-
167
-
168
-
169
-
170
-
171
-
172
-
173
-
174
-
175
-
176
-
177
-
178
-
179
-
180
-
181
-
182
-
183
-
184
-
185
-
186
-
187
-
188
-
189
-
190
-
191
-
192
-
193
-
194
-
195
-
196
-
197
-
198
-
199
-
200
-
201
-
202
-
203
-
204
-
205
-
206
-
207
-
208
-
209
-
210
-
211
-
212
-
213
-
214
-
215
-
216
-
217
-
218
-
219
-
220
-
221
-
222
-
223
-
224
-
225
-
226
-
227
-
228
-
229
-
230
-
231
-
232
-
233
-
234
-
235
-
236
-
237
-
238
-
239
-
240
-
241
-
242
-
243
-
244
-
245
-
246
-
247
-
248
-
249
-
250
-
251
-
252
-
253
-
254
-
255
-
256
-
257
-
258
-
259
-
260
-
261
-
262
-
263
-
264
-
265
-
266
-
267
 |
 |

85
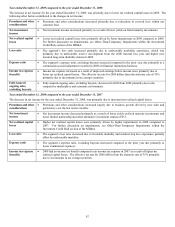
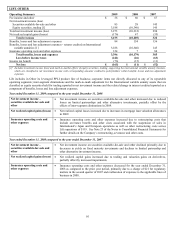
Year ended December 31, 2008 compared to the year ended December 31, 2007
Net income decreased for the year ended December 31, 2008, driven primarily by significantly higher net realized capital losses and the
impacts of the Unlock in 2008 as compared to 2007. For further discussion on the Unlock, see Unlocks within the Critical Accounting
Estimates section of the MD&A. The following other factors contributed to the changes in net income:
Fee income and other • Fee income and other increased primarily due to an increase in cost of insurance charges of $45 as a
result of growth in guaranteed universal life insurance in-force and fees on higher surrenders of $12
due to internal exchanges from non-guaranteed universal life insurance to variable universal life
insurance. Partially offsetting these increases are the impacts of the 2008 and 2007 Unlocks as well
as lower variable life fees as a result of equity market declines.
Earned premiums • Earned premiums, which include premiums for ceded reinsurance, decreased primarily due to
increased ceded reinsurance premiums due to life insurance in-force growth.
Net investment income • Net investment income decreased primarily due to lower income from limited partnerships and other
alternative investments, lower yields on fixed maturity investments, and reduced net investment
income associated with a more efficient capital approach for our secondary guarantee universal life
business, which released assets supporting capital and the related net investment income earned on
those assets (described further in the “Outlook” section), partially offset by growth in general account
values.
Net investment spread • The decrease in net investment spread was attributable to lower limited partnership returns of 52 bps
and lower fixed maturity income returns, partially offset by a reduction in the credited rate of 23 bps.
Net realized capital
losses
• Net realized capital losses increased primarily related to losses from impairments. For further
discussion on impairments, see Other-Than-Temporary Impairments within the Investment Credit
Risk section of the MD&A.
Benefits, losses and loss
adjustment expenses
• Benefits, losses and loss adjustment expenses increased as a result of higher death benefits consistent
with a larger life insurance in-force and unfavorable mortality, as well as the impact of the 2008
Unlock.
Death benefits • Death benefits increased, primarily due to growth of life insurance in-force and unfavorable
mortality.
Insurance operating
costs and other expenses
• Insurance operating costs and other increased less than the growth of in-force business as a result of
active expense management efforts.
Amortization of DAC • Amortization of DAC increased primarily as a result of the Unlock expense in 2008 as compared to
the Unlock benefit in 2007, partially offset by reduced DAC amortization primarily attributed to net
realized capital losses. This increase in DAC amortization had a partial offset in amortization of
unearned revenue reserves, included in fee income.
Income tax expense
(benefit)
• Income tax benefits were a result of lower income before income taxes primarily due to an increase
in net realized capital losses and DAC amortization.