The Hartford 2009 Annual Report Download - page 78
Download and view the complete annual report
Please find page 78 of the 2009 The Hartford annual report below. You can navigate through the pages in the report by either clicking on the pages listed below, or by using the keyword search tool below to find specific information within the annual report.-
 1
1 -
2
-
3
-
4
-
5
-
6
-
7
-
8
-
9
-
10
-
11
-
12
-
13
-
14
-
15
-
16
-
17
-
18
-
19
-
20
-
21
-
22
-
23
-
24
-
25
-
26
-
27
-
28
-
29
-
30
-
31
-
32
-
33
-
34
-
35
-
36
-
37
-
38
-
39
-
40
-
41
-
42
-
43
-
44
-
45
-
46
-
47
-
48
-
49
-
50
-
51
-
52
-
53
-
54
-
55
-
56
-
57
-
58
-
59
-
60
-
61
-
62
-
63
-
64
-
65
-
66
-
67
-
 68
68 -
 69
69 -
 70
70 -
 71
71 -
 72
72 -
 73
73 -
 74
74 -
 75
75 -
 76
76 -
 77
77 -
 78
78 -
 79
79 -
 80
80 -
 81
81 -
 82
82 -
 83
83 -
 84
84 -
 85
85 -
 86
86 -
 87
87 -
 88
88 -
89
-
90
-
91
-
92
-
93
-
94
-
95
-
96
-
97
-
98
-
99
-
100
-
101
-
102
-
103
-
104
-
105
-
106
-
107
-
108
-
109
-
110
-
111
-
112
-
113
-
114
-
115
-
116
-
117
-
118
-
119
-
120
-
121
-
122
-
123
-
124
-
125
-
126
-
127
-
128
-
129
-
130
-
131
-
132
-
133
-
134
-
135
-
136
-
137
-
138
-
139
-
140
-
141
-
142
-
143
-
144
-
145
-
146
-
147
-
148
-
149
-
150
-
151
-
152
-
153
-
154
-
155
-
156
-
157
-
158
-
159
-
160
-
161
-
162
-
163
-
164
-
165
-
166
-
167
-
168
-
169
-
170
-
171
-
172
-
173
-
174
-
175
-
176
-
177
-
178
-
179
-
180
-
181
-
182
-
183
-
184
-
185
-
186
-
187
-
188
-
189
-
190
-
191
-
192
-
193
-
194
-
195
-
196
-
197
-
198
-
199
-
200
-
201
-
202
-
203
-
204
-
205
-
206
-
207
-
208
-
209
-
210
-
211
-
212
-
213
-
214
-
215
-
216
-
217
-
218
-
219
-
220
-
221
-
222
-
223
-
224
-
225
-
226
-
227
-
228
-
229
-
230
-
231
-
232
-
233
-
234
-
235
-
236
-
237
-
238
-
239
-
240
-
241
-
242
-
243
-
244
-
245
-
246
-
247
-
248
-
249
-
250
-
251
-
252
-
253
-
254
-
255
-
256
-
257
-
258
-
259
-
260
-
261
-
262
-
263
-
264
-
265
-
266
-
267
 |
 |

78
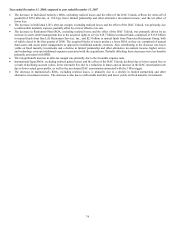
Year ended December 31, 2008 compared to the year ended December 31, 2007
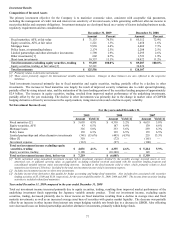
Total net investment income decreased primarily due to equity securities, trading, resulting from a decline in the value of the underlying
investment funds supporting the Japanese variable annuity product due to negative market performance year over year. Total net
investment income, excluding equity securities, trading, decreased primarily due to lower income on limited partnerships and other
alternative investments and fixed maturities. The decline in limited partnerships and other alternative investments yield was largely due
to negative returns on hedge funds and real estate partnerships as a result of the lack of liquidity in the financial markets and a wider
credit spread environment. The decline in fixed maturity income was primarily due to lower yield on variable rate securities due to
declines in short-term interest rates and increased allocation to lower yielding U.S. Treasuries and short-term investments.
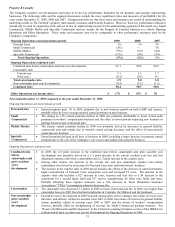
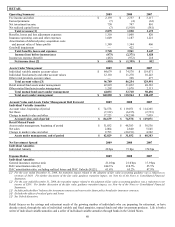
Net Realized Capital Losses
For the years ended December 31,
2009 2008 2007
Gross gains on sales $1,056 $ 607 $374
Gross losses on sales (1,397) (856) (291)
Net OTTI losses recognized in earnings (1,508) (3,964) (483)
Japanese fixed annuity contract hedges, net [1] 47 64 18
Periodic net coupon settlements on credit derivatives/Japan (49) (33) (25)
Fair value measurement transition impact [2] — (650) —
Results of variable annuity hedge program
GMWB derivatives, net 1,526 (713) (286)
Macro hedge program (895) 74 (12)
Total results of variable annuity hedge program 631 (639) (298)
Other, net (790) (447) (289)
Net realized capital losses, before-tax $(2,010) $ (5,918) $(994)
[1] Relates to derivative hedging instruments, excluding periodic net coupon settlements, and is net of the Japanese fixed annuity product liability
adjustment for changes in the dollar/yen exchange spot rate.
[2] See Note 4a of the Notes to Consolidated Financial Statements.
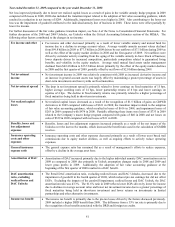
The circumstances giving rise to the Company’ s net realized capital gains and losses are as follows:
Gross
g
ains and
losses on sales
• Gross gains and losses on sales for the year ended December 31, 2009 were predominantly within corporate,
government and structured securities. Also included were gains of $360 related to the sale of Verisk/ISO
securities. Gross gains and losses on sales primarily resulted from efforts to reduce portfolio risk through sales
of subordinated financials and real estate related securities and from sales of U.S. Treasuries to manage
liquidity.
• Gross gains and losses on sales for the year ended December 31, 2008 primarily resulted from the decision to
reallocate the portfolio to securities with more favorable risk/return profiles. Also included was a gain of $141
from the sale of a synthetic CDO.
• Gross gains and losses on sales for the year ended December 31, 2007 were primarily comprised of corporate,
foreign government and municipal securities.
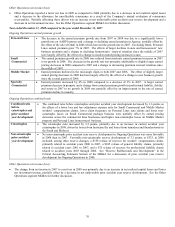
Net OTTI losses • For further information, see Other-Than-Temporary Impairments within the Investment Credit Risk section of
the MD&A.
Variable
annuity hedge
program
• For the year ended December 31, 2009, the net gain on GMWB related derivatives was primarily due to liability
model assumption updates related to favorable policyholder experience of $566, the relative outperformance of
the underlying actively managed funds as compared to their respective indices of $550, and the impact of the
Company’ s own credit standing of $154. Additional net gains of $56 resulted from lower implied market
volatility and a general increase in long-term interest rates, partially offset by rising equity markets. Increasing
equity markets resulted in a loss of $895 related to the Company’ s macro hedge program. Total gains related to
GMWB hedging in 2009 were $1.5 billion. For further information, see Note 4a of the Notes to Consolidated
Financial Statements. In addition, see the Company’ s variable annuity hedging program sensitivity disclosures
within Capital Markets Risk Management section of the MD&A.
• For the year ended December 31, 2008, the net loss on GMWB derivatives was primarily due to losses of $904
related to market-based hedge ineffectiveness due to extremely volatile capital markets and $355 related to the
relative underperformance of the underlying actively managed funds as compared to their respective indices,
partially offset by gains of $470 in the fourth quarter related to liability model assumption updates for lapse
rates.
• For the year ended December 31, 2007, the net loss on GMWB derivatives was primarily due to losses of $158
related to liability model assumption updates and model refinements made during the year, including those for
dynamic lapse behavior and correlations of market returns across underlying indices, as well as updates to
reflect newly reliable market inputs for volatility.