The Hartford 2009 Annual Report Download - page 231
Download and view the complete annual report
Please find page 231 of the 2009 The Hartford annual report below. You can navigate through the pages in the report by either clicking on the pages listed below, or by using the keyword search tool below to find specific information within the annual report.
THE HARTFORD FINANCIAL SERVICES GROUP, INC.
NOTES TO CONSOLIDATED FINANCIAL STATEMENTS (continued)
F-82
17. Pension Plans and Postretirement Health Care and Life Insurance Benefit Plans (continued)
Other Postretirement Plan Assets
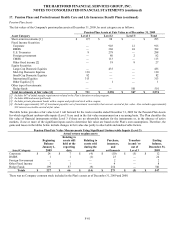
The fair value of the Company’ s other postretirement plan assets at December 31, 2009, by asset category are as follows:
Other Postretirement Plan Assets at Fair Value as of December 31, 2009
Asset Category Level 1 Level 2 Level 3 Total
Short-term investments $ — $ 7 $ — $ 7
Fixed Income Securities:
Corporate — 65 — 65
RMBS — 39 — 39
U.S. Government — 17 — 17
CMBS — 12 — 12
Other Fixed Income — 1 — 1
Equity Securities:
Large-Cap — 37 — 37
Total investments at fair value [1] $ — $ 178 $ — $ 178
[1] Excludes approximately $4 of investment payables net of investment receivables that are not carried at fair value. Also excludes approximately $1
interest receivable carried at fair value.
There was no Company common stock included in the other postretirement benefit plan assets as of December 31, 2009 and 2008.
Concentration of Risk
In order to minimize risk, the Plan maintains a listing of permissible and prohibited investments. In addition, the Plan has certain
concentration limits and investment quality requirements imposed on permissible investment options. Permissible investments include
U.S. equity, international equity, alternative asset and fixed income investments including derivative instruments. Derivative
instruments include future contracts, options, swaps, currency forwards, caps or floors and will be used to control risk or enhance return
but will not be used for leverage purposes.
Securities specifically prohibited from purchase include, but are not limited to: stock in non-public corporations, private placement or
any other non-marketable issues, letter or restricted stock, short sales of any type within long-only portfolios, share purchases involving
the use of margin, CMO residuals and support tranches, leveraged floaters and inverse floaters, including money market obligations,
tiered-index bonds, range notes and all other forms of structured notes whose return characteristics are tied to changes in prepayments
on mortgages or changes in a specified interest rate index or market rate, natural resource real properties such as oil, gas or timber and
precious metals.
Other than U.S. government and certain U.S. government agencies backed by the full faith and credit of the U.S. government, the Plan
does not have any material exposure to any concentration risk of a single issuer.
Cash Flows
The following table illustrates the Company’ s prior contributions.
Employer Contributions Pension Benefits Other Postretirement Benefits
2008 $ 2 $ —
2009 201 —
In 2009, the Company, at its discretion, made a $201 contribution to the U.S. qualified defined benefit pension plan. The Company
presently anticipates contributing approximately $200 to its pension plans and other postretirement plans in 2010 based upon certain
economic and business assumptions. These assumptions include, but are not limited to, equity market performance, changes in interest
rates and the Company’ s other capital requirements. For 2010, the Company does not have a required minimum funding contribution for
the Plan and the funding requirements for all of the pension plans are expected to be immaterial.
Employer contributions in 2009 and 2008 were made in cash and did not include contributions of the Company’ s common stock.


