The Hartford 2009 Annual Report Download - page 190
Download and view the complete annual report
Please find page 190 of the 2009 The Hartford annual report below. You can navigate through the pages in the report by either clicking on the pages listed below, or by using the keyword search tool below to find specific information within the annual report.-
 1
1 -
2
-
3
-
4
-
5
-
6
-
7
-
8
-
9
-
10
-
11
-
12
-
13
-
14
-
15
-
16
-
17
-
18
-
19
-
20
-
21
-
22
-
23
-
24
-
25
-
26
-
27
-
28
-
29
-
30
-
31
-
32
-
33
-
34
-
35
-
36
-
37
-
38
-
39
-
40
-
41
-
42
-
43
-
44
-
45
-
46
-
47
-
48
-
49
-
50
-
51
-
52
-
53
-
54
-
55
-
56
-
57
-
58
-
59
-
60
-
61
-
62
-
63
-
64
-
65
-
66
-
67
-
68
-
69
-
70
-
71
-
72
-
73
-
74
-
75
-
76
-
77
-
78
-
79
-
80
-
81
-
82
-
83
-
84
-
85
-
86
-
87
-
88
-
89
-
90
-
91
-
92
-
93
-
94
-
95
-
96
-
97
-
98
-
99
-
100
-
101
-
102
-
103
-
104
-
105
-
106
-
107
-
108
-
109
-
110
-
111
-
112
-
113
-
114
-
115
-
116
-
117
-
118
-
119
-
120
-
121
-
122
-
123
-
124
-
125
-
126
-
127
-
128
-
129
-
130
-
131
-
132
-
133
-
134
-
135
-
136
-
137
-
138
-
139
-
140
-
141
-
142
-
143
-
144
-
145
-
146
-
147
-
148
-
149
-
150
-
151
-
152
-
153
-
154
-
155
-
156
-
157
-
158
-
159
-
160
-
161
-
162
-
163
-
164
-
165
-
166
-
167
-
168
-
169
-
170
-
171
-
172
-
173
-
174
-
175
-
176
-
177
-
178
-
179
-
 180
180 -
 181
181 -
 182
182 -
 183
183 -
 184
184 -
 185
185 -
 186
186 -
 187
187 -
 188
188 -
 189
189 -
 190
190 -
 191
191 -
 192
192 -
 193
193 -
 194
194 -
 195
195 -
 196
196 -
 197
197 -
 198
198 -
 199
199 -
 200
200 -
201
-
202
-
203
-
204
-
205
-
206
-
207
-
208
-
209
-
210
-
211
-
212
-
213
-
214
-
215
-
216
-
217
-
218
-
219
-
220
-
221
-
222
-
223
-
224
-
225
-
226
-
227
-
228
-
229
-
230
-
231
-
232
-
233
-
234
-
235
-
236
-
237
-
238
-
239
-
240
-
241
-
242
-
243
-
244
-
245
-
246
-
247
-
248
-
249
-
250
-
251
-
252
-
253
-
254
-
255
-
256
-
257
-
258
-
259
-
260
-
261
-
262
-
263
-
264
-
265
-
266
-
267
 |
 |
THE HARTFORD FINANCIAL SERVICES GROUP, INC.
NOTES TO CONSOLIDATED FINANCIAL STATEMENTS (continued)
F-41
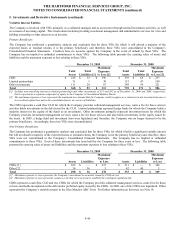
5. Investments and Derivative Instruments (continued)
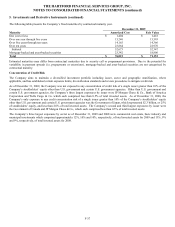
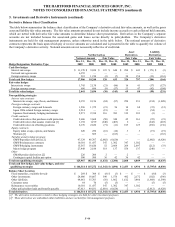
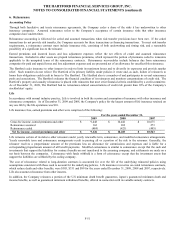
Equity Method Investments
The Company has investments in limited partnerships and other alternative investments which include hedge funds, mortgage and real
estate funds, mezzanine debt funds, and private equity and other funds (collectively, “limited partnerships”). These investments are
accounted for under the equity method and the Company’ s maximum exposure to loss as of December 31, 2009 is limited to the total
carrying value of $1.8 billion. In addition, the Company has outstanding commitments totaling approximately $886, to fund limited
partnership and other alternative investments as of December 31, 2009. The Company’ s investments in limited partnerships are
generally of a passive nature in that the Company does not take an active role in the management of the limited partnerships. In 2009,
aggregate investment losses from limited partnerships and other alternative investments exceeded 10% of the Company’ s pre-tax
consolidated net income. Accordingly, the Company is disclosing aggregated summarized financial data for the Company’ s limited
partnership investments. This aggregated summarized financial data does not represent the Company’ s proportionate share of limited
partnership assets or earnings. Aggregate total assets of the limited partnerships in which the Company invested totaled $80.7 billion
and $81.2 billion as of December 31, 2009 and 2008, respectively. Aggregate total liabilities of the limited partnerships in which the
Company invested totaled $24.6 billion and $27.0 billion as of December 31, 2009 and 2008, respectively. Aggregate net investment
income (loss) of the limited partnerships in which the Company invested totaled $(688), $(228) and $308 for the periods ended
December 31, 2009, 2008 and 2007, respectively. Aggregate net income (loss) of the limited partnerships in which the Company
invested totaled $(9.1) billion, $(19.7) billion and $4.5 billion for the periods ended December 31, 2009, 2008 and 2007, respectively.
As of, and for the period ended, December 31, 2009, the aggregated summarized financial data reflects the latest available financial
information.
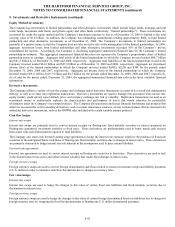
Derivative Instruments
The Company utilizes a variety of over-the-counter and exchange traded derivative instruments as a part of its overall risk management
strategy, as well as to enter into replication transactions. Derivative instruments are used to manage risk associated with interest rate,
equity market, credit spread, issuer default, price, and currency exchange rate risk or volatility. Replication transactions are used as an
economical means to synthetically replicate the characteristics and performance of assets that would otherwise be permissible
investments under the Company’ s investment policies. The Company also purchases and issues financial instruments and products that
either are accounted for as free-standing derivatives, such as certain reinsurance contracts, or may contain features that are deemed to be
embedded derivative instruments, such as the GMWB rider included with certain variable annuity products.
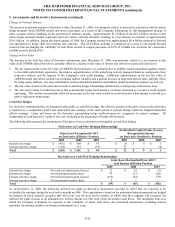
Cash flow hedges
Interest rate swaps
Interest rate swaps are primarily used to convert interest receipts on floating-rate fixed maturity securities or interest payments on
floating-rate guaranteed investment contracts to fixed rates. These derivatives are predominantly used to better match cash receipts
from assets with cash disbursements required to fund liabilities.
The Company also enters into forward starting swap agreements to hedge the interest rate exposure related to the purchase of fixed-rate
securities or the anticipated future cash flows of floating-rate fixed maturity securities due to changes in interest rates. These derivatives
are primarily structured to hedge interest rate risk inherent in the assumptions used to price certain liabilities.
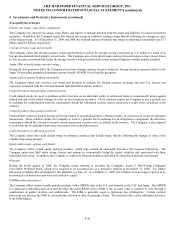
Forward rate agreements
Forward rate agreements are used to convert interest receipts on floating-rate securities to fixed rates. These derivatives are used to lock
in the forward interest rate curve and reduce income volatility that results from changes in interest rates.
Foreign currency swaps
Foreign currency swaps are used to convert foreign denominated cash flows related to certain investment receipts and liability payments
to U.S. dollars in order to minimize cash flow fluctuations due to changes in currency rates.
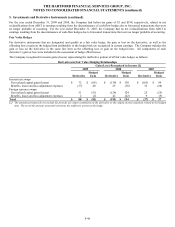
Fair value hedges
Interest rate swaps
Interest rate swaps are used to hedge the changes in fair value of certain fixed rate liabilities and fixed maturity securities due to
fluctuations in interest rates.
Foreign currency swaps
Foreign currency swaps are used to hedge the changes in fair value of certain foreign denominated fixed rate liabilities due to changes in
foreign currency rates by swapping the fixed foreign payments to floating rate U.S. dollar denominated payments.