The Hartford 2009 Annual Report Download - page 132
Download and view the complete annual report
Please find page 132 of the 2009 The Hartford annual report below. You can navigate through the pages in the report by either clicking on the pages listed below, or by using the keyword search tool below to find specific information within the annual report.-
 1
1 -
2
-
3
-
4
-
5
-
6
-
7
-
8
-
9
-
10
-
11
-
12
-
13
-
14
-
15
-
16
-
17
-
18
-
19
-
20
-
21
-
22
-
23
-
24
-
25
-
26
-
27
-
28
-
29
-
30
-
31
-
32
-
33
-
34
-
35
-
36
-
37
-
38
-
39
-
40
-
41
-
42
-
43
-
44
-
45
-
46
-
47
-
48
-
49
-
50
-
51
-
52
-
53
-
54
-
55
-
56
-
57
-
58
-
59
-
60
-
61
-
62
-
63
-
64
-
65
-
66
-
67
-
68
-
69
-
70
-
71
-
72
-
73
-
74
-
75
-
76
-
77
-
78
-
79
-
80
-
81
-
82
-
83
-
84
-
85
-
86
-
87
-
88
-
89
-
90
-
91
-
92
-
93
-
94
-
95
-
96
-
97
-
98
-
99
-
100
-
101
-
102
-
103
-
104
-
105
-
106
-
107
-
108
-
109
-
110
-
111
-
112
-
113
-
114
-
115
-
116
-
117
-
118
-
119
-
120
-
121
-
 122
122 -
 123
123 -
 124
124 -
 125
125 -
 126
126 -
 127
127 -
 128
128 -
 129
129 -
 130
130 -
 131
131 -
 132
132 -
 133
133 -
 134
134 -
 135
135 -
 136
136 -
 137
137 -
 138
138 -
 139
139 -
 140
140 -
 141
141 -
 142
142 -
143
-
144
-
145
-
146
-
147
-
148
-
149
-
150
-
151
-
152
-
153
-
154
-
155
-
156
-
157
-
158
-
159
-
160
-
161
-
162
-
163
-
164
-
165
-
166
-
167
-
168
-
169
-
170
-
171
-
172
-
173
-
174
-
175
-
176
-
177
-
178
-
179
-
180
-
181
-
182
-
183
-
184
-
185
-
186
-
187
-
188
-
189
-
190
-
191
-
192
-
193
-
194
-
195
-
196
-
197
-
198
-
199
-
200
-
201
-
202
-
203
-
204
-
205
-
206
-
207
-
208
-
209
-
210
-
211
-
212
-
213
-
214
-
215
-
216
-
217
-
218
-
219
-
220
-
221
-
222
-
223
-
224
-
225
-
226
-
227
-
228
-
229
-
230
-
231
-
232
-
233
-
234
-
235
-
236
-
237
-
238
-
239
-
240
-
241
-
242
-
243
-
244
-
245
-
246
-
247
-
248
-
249
-
250
-
251
-
252
-
253
-
254
-
255
-
256
-
257
-
258
-
259
-
260
-
261
-
262
-
263
-
264
-
265
-
266
-
267
 |
 |

132
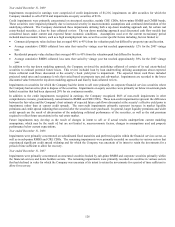
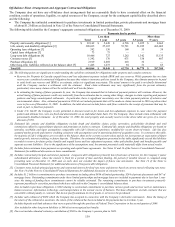
GMDB and GMIB
The majority of the Company’ s U.S. variable annuity contracts include a GMDB rider. Declines in the equity markets will generally
increase the Company’ s liability for GMDB riders. The Company’ s total gross exposure (i.e., before reinsurance) to U.S. GMDB as of
December 31, 2009 is $18.4 billion. However, the Company will incur these payments in the future only if the policyholder has an ‘in
the money’ GMDB at their death. The Company currently reinsures 53% of these death benefit guarantees. Under certain of these
reinsurance agreements, the reinsurers’ exposure is subject to an annual cap. The Company’ s net exposure (i.e., after reinsurance) is
$8.5 billion, as of December 31, 2009.
In the second quarter of 2009, the Company suspended all new product sales in Japan. Prior to that, the Company offered certain
variable annuity products in Japan with both a GMDB and a GMIB. For the in-force block of Japan business, declines in equity
markets, as well as a strengthening of the Japanese yen in comparison to the U.S. dollar and other currencies, will increase the
Company’ s liability for GMDB and GMIB riders. This increase may be significant in extreme market scenarios. The Company’ s total
gross exposure (i.e., before reinsurance) to the GMDB and GMIB offered in Japan as of December 31, 2009 is $6.3 billion. However,
the Company will incur these payments in the future only if the contract holder has an ‘in the money’ GMDB and GMIB at their death
or if their account value is insufficient to fund the benefit. The Company currently reinsures 17% of the GMDB to a third party
reinsurer. Under certain of these reinsurance agreements, the reinsurers’ exposure is subject to an annual cap. The Company’ s net
exposure (i.e. after reinsurance) is $5.2 billion. In addition, as of December 31, 2009, 59% of the account value and 52% of retained net
amount at risk is reinsured to a Hartford affiliate. For additional information on the Company’ s GMDB and GMIB liability, see Note 9
of the Notes to Consolidated Financial Statements.
Life’ s Equity Product Risk Management
The Company has made considerable investment in analyzing market risk exposures arising from: GMDB, GMWB, and GMIB; equity
market and interest rate risks; and foreign currency exchange rates. The Company evaluates these risks both individually and, in the
aggregate, to determine the financial risk of its products and to judge their potential impacts on U.S. GAAP earnings and statutory
surplus. The Company manages the equity market, interest rate and foreign currency exchange risks embedded in its products through
product design, reinsurance, customized derivatives, and dynamic hedging and macro hedging programs. The Company recently
launched a new variable annuity product with reduced equity risk and has increased GMWB rider fees on new sales of the Company’ s
legacy variable annuities and the related in-force, as contractually permitted. Depending upon competitors’ reactions with respect to
products and related rider charges, the Company’ s strategy of reducing product risk and increasing fees may cause a decline in market
share.
Reinsurance
The Company uses reinsurance for a portion of contracts issued with GMWB riders prior to the third quarter of 2003. The Company
also reinsures GMWB risks associated with a block of business sold between the third quarter of 2003 and the second quarter of 2006.
The Company also uses reinsurance for a majority of the GMDB issued in the U.S. and a portion of the GMDB issued in Japan.
Derivative Hedging Programs
The Company maintains derivative hedging programs for its product guarantee risk to meet multiple, and in some cases, competing risk
management objectives, including providing protection against tail scenario equity market events, providing resources to pay product
guarantee claims, and minimizing U.S. GAAP earnings volatility, statutory surplus volatility and other economic metrics.
The Company holds customized derivative contracts to provide protection from certain capital market risks for the remaining term of
specified blocks of non-reinsured GMWB riders. These customized derivative contracts are based on policyholder behavior assumptions
specified at the inception of the derivative contracts. The Company retains the risk for actual policyholder behavior that is different
from assumptions within the customized derivatives.
The Company’ s dynamic hedging program uses derivative instruments to manage the U.S. GAAP earnings volatility associated with
variable annuity product guarantees including equity market declines, equity implied volatility, declines in interest rates and foreign
currency exchange risk. The Company uses hedging instruments including interest rate futures and swaps, variance swaps, S&P 500,
NASDAQ and EAFE index put options and futures contracts. While the Company actively manages this dynamic hedging program,
increased U.S. GAAP earnings volatility may result from factors including, but not limited to, policyholder behavior, capital markets,
divergence between the performance of the underlying funds and the hedging indices, and the relative emphasis placed on various risk
management objectives.
The Company’ s macro hedging program uses derivative instruments to partially hedge the statutory tail scenario risk arising from U.S.
and Japan GMWB, GMDB, and GMIB statutory liabilities, on the Company’ s statutory surplus and the associated target RBC ratios
(see Capital Resources and Liquidity). The macro hedge program will result in additional cost and U.S. GAAP earnings volatility in
times of market increases as changes in the value of the macro hedge derivatives which hedge statutory liabilities may not be closely
aligned to changes in U.S. GAAP liabilities.
For additional information on hedging derivatives, see Note 5 of the Notes to Consolidated Financial Statements.