The Hartford 2009 Annual Report Download - page 133
Download and view the complete annual report
Please find page 133 of the 2009 The Hartford annual report below. You can navigate through the pages in the report by either clicking on the pages listed below, or by using the keyword search tool below to find specific information within the annual report.-
 1
1 -
2
-
3
-
4
-
5
-
6
-
7
-
8
-
9
-
10
-
11
-
12
-
13
-
14
-
15
-
16
-
17
-
18
-
19
-
20
-
21
-
22
-
23
-
24
-
25
-
26
-
27
-
28
-
29
-
30
-
31
-
32
-
33
-
34
-
35
-
36
-
37
-
38
-
39
-
40
-
41
-
42
-
43
-
44
-
45
-
46
-
47
-
48
-
49
-
50
-
51
-
52
-
53
-
54
-
55
-
56
-
57
-
58
-
59
-
60
-
61
-
62
-
63
-
64
-
65
-
66
-
67
-
68
-
69
-
70
-
71
-
72
-
73
-
74
-
75
-
76
-
77
-
78
-
79
-
80
-
81
-
82
-
83
-
84
-
85
-
86
-
87
-
88
-
89
-
90
-
91
-
92
-
93
-
94
-
95
-
96
-
97
-
98
-
99
-
100
-
101
-
102
-
103
-
104
-
105
-
106
-
107
-
108
-
109
-
110
-
111
-
112
-
113
-
114
-
115
-
116
-
117
-
118
-
119
-
120
-
121
-
122
-
 123
123 -
 124
124 -
 125
125 -
 126
126 -
 127
127 -
 128
128 -
 129
129 -
 130
130 -
 131
131 -
 132
132 -
 133
133 -
 134
134 -
 135
135 -
 136
136 -
 137
137 -
 138
138 -
 139
139 -
 140
140 -
 141
141 -
 142
142 -
 143
143 -
144
-
145
-
146
-
147
-
148
-
149
-
150
-
151
-
152
-
153
-
154
-
155
-
156
-
157
-
158
-
159
-
160
-
161
-
162
-
163
-
164
-
165
-
166
-
167
-
168
-
169
-
170
-
171
-
172
-
173
-
174
-
175
-
176
-
177
-
178
-
179
-
180
-
181
-
182
-
183
-
184
-
185
-
186
-
187
-
188
-
189
-
190
-
191
-
192
-
193
-
194
-
195
-
196
-
197
-
198
-
199
-
200
-
201
-
202
-
203
-
204
-
205
-
206
-
207
-
208
-
209
-
210
-
211
-
212
-
213
-
214
-
215
-
216
-
217
-
218
-
219
-
220
-
221
-
222
-
223
-
224
-
225
-
226
-
227
-
228
-
229
-
230
-
231
-
232
-
233
-
234
-
235
-
236
-
237
-
238
-
239
-
240
-
241
-
242
-
243
-
244
-
245
-
246
-
247
-
248
-
249
-
250
-
251
-
252
-
253
-
254
-
255
-
256
-
257
-
258
-
259
-
260
-
261
-
262
-
263
-
264
-
265
-
266
-
267
 |
 |

133
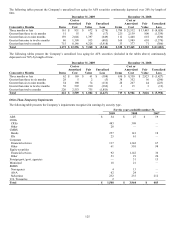
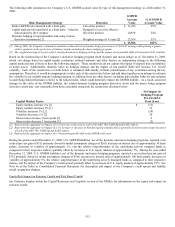
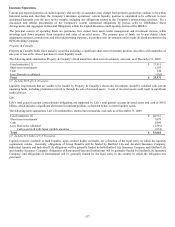
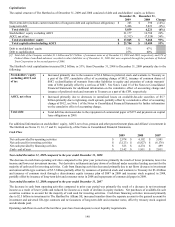
The following table summarizes the Company’ s U.S. GMWB account value by type of risk management strategy, as of December 31,
2009:
Risk Management Strategy Duration
GMWB
Account
Value
% of GMWB
Account Value
Entire GMWB risk reinsured with a third party Life of the product $ 11,299 25%
Capital markets risk transferred to a third party – behavior
risk retained by the Company
Designed to cover the effective
life of the product
10,838 24%
Dynamic hedging of capital markets risk using various
derivative instruments [1] Weighted average of 4 years [2]
23,369 51%
$ 45,506 100%
[1] During 2009, the Company continued to maintain a reduced level of dynamic hedge protection on U.S GAAP earnings while placing a greater
relative emphasis on the protection of statutory surplus including the macro hedging program.
[2] The weighted average of 4 years reflects varying durations by hedging strategy and the impact of non parallel shifts will increase GAAP volatility.
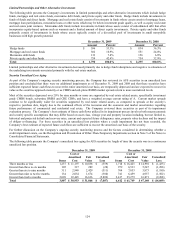
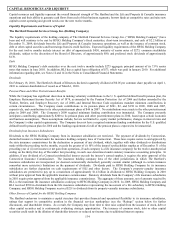
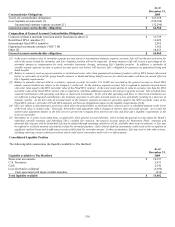
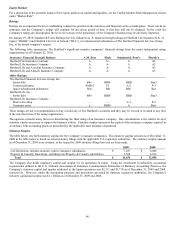
Based on the construction of the Company’ s derivative hedging program (both dynamic and macro hedge) as of December 31, 2009,
which can change based on capital market conditions, notional amounts and other factors, an independent change in the following
capital market factors is likely to have the following impacts. These sensitivities do not capture the impact of elapsed time on liabilities
or hedge assets. Additionally, duration varies by hedging strategy and the impact of non parallel shifts will increase U.S. GAAP
volatility. Each of the sensitivities set forth below is estimated individually, without consideration of any correlation among the key
assumptions. Therefore, it would be inappropriate to take each of the sensitivities below and add them together in an attempt to estimate
the volatility in our variable annuity hedging program. In addition, there are other factors, including policyholder behavior and variation
in underlying fund performance relative to the hedged index, which could materially impact the GMWB liability. As a result, actual net
changes in the value of the GMWB liability, the related dynamic hedging program derivative assets and the macro hedge program
derivative assets may vary materially from those calculated using only the sensitivities disclosed below:
Capital Market Factor
Net Impact on
Hedging Program
Pre-Tax/DAC
Gain (Loss)
Equity markets increase 1% [1] $ (12)
Equity markets decrease 1% [1] 12
Volatility increases 1% [2] (30)
Volatility decreases 1% [2] 30
Interest rates increase 1 basis point [3] 2
Interest rates decrease 1 basis point [3] (2)
[1] Represents the aggregate net impact of a 1% increase or decrease in each of the S&P 500, NASDAQ and EAFE indices.
[2] Represents the aggregate net impact of a 1% increase or decrease in blended implied volatility that is generally skewed towards longer durations
of each of the S&P 500, NASDAQ and EAFE indices.
[3] Represents the aggregate net impact of a 1 basis point parallel shift on the LIBOR yield curve.
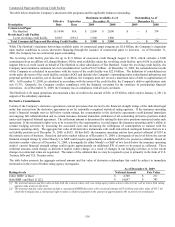
During the quarter ended December 31, 2009, U.S. GMWB liabilities, net of the dynamic and macro hedging programs, reported a net
realized pre-tax gain of $311 primarily driven by model assumption changes of $260, increases in interest rate of approximately 50 basis
points, decreases in volatility of approximately 1%, and the relative outperformance of the underlying actively managed funds as
compared to their respective indices, partially offset by increases in U.S. equity markets of approximately 5%. During the year ended
December 31, 2009, U.S. GMWB liabilities, net of the dynamic and macro hedging programs, reported a net realized pre-tax gain of
$732 primarily driven by model assumption changes of $566, increases in interest rates of approximately 100 basis points, decreases in
volatility of approximately 5%, the relative outperformance of the underlying actively managed funds as compared to their respective
indices, and the impact of the Company’ s credit spread, partially offset by increases in U.S. equity markets of approximately 25%. See
Note 4a of the Notes to Consolidated Financial Statements for description and impact of the Company’ s credit spread and liability
model assumption changes.
Equity Risk Impact on Statutory Capital and Risk Based Capital
See Statutory Surplus within the Capital Resources and Liquidity section of the MD&A for information on the equity risk impact on
statutory results.