The Hartford 2009 Annual Report Download - page 228
Download and view the complete annual report
Please find page 228 of the 2009 The Hartford annual report below. You can navigate through the pages in the report by either clicking on the pages listed below, or by using the keyword search tool below to find specific information within the annual report.-
 1
1 -
2
-
3
-
4
-
5
-
6
-
7
-
8
-
9
-
10
-
11
-
12
-
13
-
14
-
15
-
16
-
17
-
18
-
19
-
20
-
21
-
22
-
23
-
24
-
25
-
26
-
27
-
28
-
29
-
30
-
31
-
32
-
33
-
34
-
35
-
36
-
37
-
38
-
39
-
40
-
41
-
42
-
43
-
44
-
45
-
46
-
47
-
48
-
49
-
50
-
51
-
52
-
53
-
54
-
55
-
56
-
57
-
58
-
59
-
60
-
61
-
62
-
63
-
64
-
65
-
66
-
67
-
68
-
69
-
70
-
71
-
72
-
73
-
74
-
75
-
76
-
77
-
78
-
79
-
80
-
81
-
82
-
83
-
84
-
85
-
86
-
87
-
88
-
89
-
90
-
91
-
92
-
93
-
94
-
95
-
96
-
97
-
98
-
99
-
100
-
101
-
102
-
103
-
104
-
105
-
106
-
107
-
108
-
109
-
110
-
111
-
112
-
113
-
114
-
115
-
116
-
117
-
118
-
119
-
120
-
121
-
122
-
123
-
124
-
125
-
126
-
127
-
128
-
129
-
130
-
131
-
132
-
133
-
134
-
135
-
136
-
137
-
138
-
139
-
140
-
141
-
142
-
143
-
144
-
145
-
146
-
147
-
148
-
149
-
150
-
151
-
152
-
153
-
154
-
155
-
156
-
157
-
158
-
159
-
160
-
161
-
162
-
163
-
164
-
165
-
166
-
167
-
168
-
169
-
170
-
171
-
172
-
173
-
174
-
175
-
176
-
177
-
178
-
179
-
180
-
181
-
182
-
183
-
184
-
185
-
186
-
187
-
188
-
189
-
190
-
191
-
192
-
193
-
194
-
195
-
196
-
197
-
198
-
199
-
200
-
201
-
202
-
203
-
204
-
205
-
206
-
207
-
208
-
209
-
210
-
211
-
212
-
213
-
214
-
215
-
216
-
217
-
 218
218 -
 219
219 -
 220
220 -
 221
221 -
 222
222 -
 223
223 -
 224
224 -
 225
225 -
 226
226 -
 227
227 -
 228
228 -
 229
229 -
 230
230 -
 231
231 -
 232
232 -
 233
233 -
 234
234 -
 235
235 -
 236
236 -
 237
237 -
 238
238 -
239
-
240
-
241
-
242
-
243
-
244
-
245
-
246
-
247
-
248
-
249
-
250
-
251
-
252
-
253
-
254
-
255
-
256
-
257
-
258
-
259
-
260
-
261
-
262
-
263
-
264
-
265
-
266
-
267
 |
 |

THE HARTFORD FINANCIAL SERVICES GROUP, INC.
NOTES TO CONSOLIDATED FINANCIAL STATEMENTS (continued)
F-79
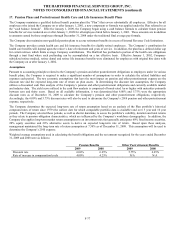
17. Pension Plans and Postretirement Health Care and Life Insurance Benefit Plans (continued)
The fair value of assets for pension benefits, and hence the funded status, presented in the table above exclude assets of $140 and $126
held in rabbi trusts and designated for the non-qualified pension plans as of December 31, 2009 and 2008, respectively. The assets do
not qualify as plan assets and, therefore, have been excluded from the table above. The assets consist of equity and fixed income
investments and are available to pay benefits for certain retired, terminated and active participants. Such assets are available to the
Company’ s general creditors in the event of insolvency. To the extent the fair value of these trusts were included in the table above,
pension plan assets would have been $3,666 and $3,452 as of December 31, 2009 and 2008, respectively, and the funded status of
pension benefits would have been $(617) and $(486) as of December 31, 2009 and 2008, respectively.
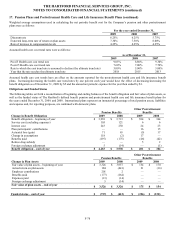
The accumulated benefit obligation for all defined benefit pension plans was $4,252 and $3,914 as of December 31, 2009 and 2008,
respectively.
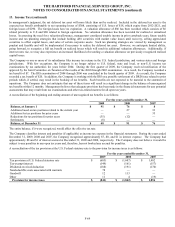
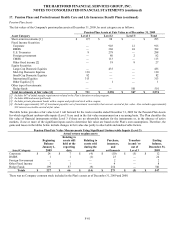
The following table provides information for The Hartford’ s defined benefit pension plans with an accumulated benefit obligation in
excess of plan assets as of December 31, 2009 and 2008.
December 31,
2009 2008
Projected benefit obligation $ 4,239 $ 3,893
Accumulated benefit obligation 4,209 3,869
Fair value of plan assets 3,471 3,275
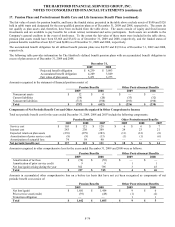
Amounts recognized in the statement of financial position consist of:
Pension Benefits Other Postretirement Benefits
2009 2008 2009 2008
Noncurrent assets $ 12 $ 6 $ — $ —
Current liabilities (54) (20) (33) (32)
Noncurrent liabilities (715) (598) (193) (198)
Total $ (757) $ (612) $ (226) $ (230)
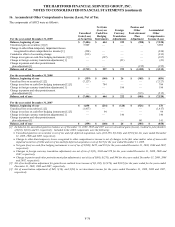
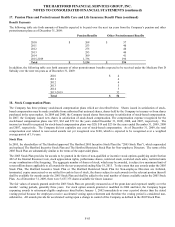
Components of Net Periodic Benefit Cost and Other Amounts Recognized in Other Comprehensive Income
Total net periodic benefit cost for the years ended December 31, 2009, 2008 and 2007 include the following components:
Pension Benefits Other Postretirement Benefits
2009 2008 2007 2009 2008 2007
Service cost $ 105 $ 121 $ 128 $ 6 $ 6 $ 7
Interest cost 243 230 209 24 23 21
Expected return on plan assets (276) (279) (283) (11) (12) (8)
Amortization of prior service credit (9) (9) (13) (1) (1) (6)
Amortization of actuarial loss 74 59 90 — — —
Net periodic benefit cost $ 137 $ 122 $ 131 $ 18 $ 16 $ 14
Amounts recognized in other comprehensive loss for the years ended December 31, 2009 and 2008 were as follows:
Pension Benefits Other Postretirement Benefits
2009 2008 2009 2008
Amortization of net loss $ (74) $ (59) $ — $ —
Amortization of prior service credit 9 9 1 1
Net loss/(gain) arising during the year 302 795 3 45
Total $ 237 $ 745 $ 4 $ 46
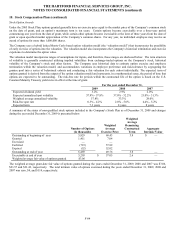
Amounts in accumulated other comprehensive loss on a before tax basis that have not yet been recognized as components of net
periodic benefit cost consist of:
Pension Benefits Other Postretirement Benefits
2009 2008 2009 2008
Net loss/(gain) $ 1,681 $ 1,454 $ 9 $ 6
Prior service cost/(credit) (39) (49) (1) (2)
Transition obligation — — 1 1
Total $ 1,642 $ 1,405 $ 9 $ 5