The Hartford 2009 Annual Report Download - page 77
Download and view the complete annual report
Please find page 77 of the 2009 The Hartford annual report below. You can navigate through the pages in the report by either clicking on the pages listed below, or by using the keyword search tool below to find specific information within the annual report.-
 1
1 -
2
-
3
-
4
-
5
-
6
-
7
-
8
-
9
-
10
-
11
-
12
-
13
-
14
-
15
-
16
-
17
-
18
-
19
-
20
-
21
-
22
-
23
-
24
-
25
-
26
-
27
-
28
-
29
-
30
-
31
-
32
-
33
-
34
-
35
-
36
-
37
-
38
-
39
-
40
-
41
-
42
-
43
-
44
-
45
-
46
-
47
-
48
-
49
-
50
-
51
-
52
-
53
-
54
-
55
-
56
-
57
-
58
-
59
-
60
-
61
-
62
-
63
-
64
-
65
-
66
-
 67
67 -
 68
68 -
 69
69 -
 70
70 -
 71
71 -
 72
72 -
 73
73 -
 74
74 -
 75
75 -
 76
76 -
 77
77 -
 78
78 -
 79
79 -
 80
80 -
 81
81 -
 82
82 -
 83
83 -
 84
84 -
 85
85 -
 86
86 -
 87
87 -
88
-
89
-
90
-
91
-
92
-
93
-
94
-
95
-
96
-
97
-
98
-
99
-
100
-
101
-
102
-
103
-
104
-
105
-
106
-
107
-
108
-
109
-
110
-
111
-
112
-
113
-
114
-
115
-
116
-
117
-
118
-
119
-
120
-
121
-
122
-
123
-
124
-
125
-
126
-
127
-
128
-
129
-
130
-
131
-
132
-
133
-
134
-
135
-
136
-
137
-
138
-
139
-
140
-
141
-
142
-
143
-
144
-
145
-
146
-
147
-
148
-
149
-
150
-
151
-
152
-
153
-
154
-
155
-
156
-
157
-
158
-
159
-
160
-
161
-
162
-
163
-
164
-
165
-
166
-
167
-
168
-
169
-
170
-
171
-
172
-
173
-
174
-
175
-
176
-
177
-
178
-
179
-
180
-
181
-
182
-
183
-
184
-
185
-
186
-
187
-
188
-
189
-
190
-
191
-
192
-
193
-
194
-
195
-
196
-
197
-
198
-
199
-
200
-
201
-
202
-
203
-
204
-
205
-
206
-
207
-
208
-
209
-
210
-
211
-
212
-
213
-
214
-
215
-
216
-
217
-
218
-
219
-
220
-
221
-
222
-
223
-
224
-
225
-
226
-
227
-
228
-
229
-
230
-
231
-
232
-
233
-
234
-
235
-
236
-
237
-
238
-
239
-
240
-
241
-
242
-
243
-
244
-
245
-
246
-
247
-
248
-
249
-
250
-
251
-
252
-
253
-
254
-
255
-
256
-
257
-
258
-
259
-
260
-
261
-
262
-
263
-
264
-
265
-
266
-
267
 |
 |

77
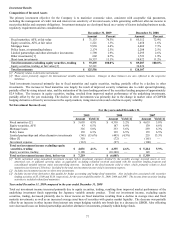
Investment Results
Composition of Invested Assets
The primary investment objective for the Company is to maximize economic value, consistent with acceptable risk parameters,
including the management of credit risk and interest rate sensitivity of invested assets, while generating sufficient after-tax income to
meet policyholder and corporate obligations. Investment strategies are developed based on a variety of factors including business needs,
regulatory requirements and tax considerations.
December 31, 2009 December 31, 2008
Amount Percent
Amount Percent
Fixed maturities, AFS, at fair value $ 71,153 76.3% $ 65,112 72.9%
Equity securities, AFS, at fair value 1,221 1.3% 1,458 1.6%
Mortgage loans 5,938 6.4% 6,469 7.3%
Policy loans, at outstanding balance 2,174 2.3% 2,208 2.5%
Limited partnerships and other alternative investments 1,790 1.9% 2,295 2.6%
Other investments [1] 602 0.7% 1,723 1.9%
Short-term investments 10,357 11.1% 10,022 11.2%
Total investments excluding equity securities, trading $ 93,235 100.0% $ 89,287 100.0%
Equity securities, trading, at fair value [2] 32,321 30,820
Total investments $ 125,556 $ 120,107
[1] Primarily relates to derivative instruments.
[2] These assets primarily support the International variable annuity business. Changes in these balances are also reflected in the respective
liabilities.
Total investments increased primarily due to fixed maturities and equity securities, trading, partially offset by a decline in other
investments. The increase in fixed maturities was largely the result of improved security valuations due to credit spread tightening,
partially offset by rising interest rates, and the maturation of the term lending portion of the securities lending program of approximately
$2.9 billion. The increase in equity securities, trading, resulted from improved market performance of the underlying investments,
partially offset by the yen weakening. The decline in other investments was primarily due to the change in market value of GMWB
hedging derivatives driven by an increase in the equity markets, rising interest rates and a decline in equity volatility.
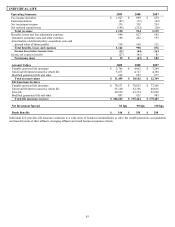
Net Investment Income (Loss)
For the years ended December 31,
2009 2008 2007
Amount Yield [1] Amount Yield [1] Amount Yield [1]
Fixed maturities [2] $3,618 4.5% $ 4,310 5.2% $ 4,653 5.8%
Equity securities, AFS 93 6.5% 167 6.9% 139 6.6%
Mortgage loans 316 5.0% 333 5.6% 293 6.3%
Policy loans 139 6.3% 139 6.5% 135 6.5%
Limited partnerships and other alternative investments (341) (15.6%) (445) (4.3%) 255 13.3%
Other [3] 318 — (72) — (161) —
Investment expense (112) — (97) — (100) —
Total net investment income excluding equity
securities, trading $4,031 4.1%
$4,335 4.6%
$5,214 5.9%
Equity securities, trading 3,188 — (10,340) — 145 —
Total net investment income (loss), before-tax $7,219 $ (6,005) $ 5,359
[1] Yields calculated using annualized investment income before investment expenses divided by the monthly average invested assets at cost,
amortized cost, or adjusted carrying value, as applicable, excluding collateral received associated with the securities lending program and
consolidated variable interest entity noncontrolling interests. Included in the fixed maturity yield is other, which primarily relates to fixed
maturities (see footnote [3] below). Included in the total net investment income yield is investment expense.
[2] Includes net investment income on short-term investments.
[3] Includes income from derivatives that qualify for hedge accounting and hedge fixed maturities. Also includes fees associated with securities
lending activities of $5, $100 and $138, respectively, for the years ended December 31, 2009, 2008 and 2007. The income from securities lending
activities is included within fixed maturities.
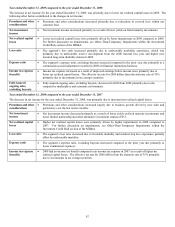
Year ended December 31, 2009 compared to the year ended December 31, 2008
Total net investment income increased primarily due to equity securities, trading, resulting from improved market performance of the
underlying investment funds supporting the Japanese variable annuity product. Total net investment income, excluding equity
securities, trading, decreased primarily due to lower income on fixed maturities resulting from a decline in average rates and fixed
maturity investments, as well as an increased average asset base of securities with greater market liquidity. The decrease was partially
offset by an increase in other income from interest rate swaps hedging variable rate bonds due to a decrease in LIBOR. Also offsetting
were decreased losses on limited partnerships and other alternative investments, primarily within hedge funds.