The Hartford 2009 Annual Report Download - page 53
Download and view the complete annual report
Please find page 53 of the 2009 The Hartford annual report below. You can navigate through the pages in the report by either clicking on the pages listed below, or by using the keyword search tool below to find specific information within the annual report.-
 1
1 -
2
-
3
-
4
-
5
-
6
-
7
-
8
-
9
-
10
-
11
-
12
-
13
-
14
-
15
-
16
-
17
-
18
-
19
-
20
-
21
-
22
-
23
-
24
-
25
-
26
-
27
-
28
-
29
-
30
-
31
-
32
-
33
-
34
-
35
-
36
-
37
-
38
-
39
-
40
-
41
-
42
-
 43
43 -
 44
44 -
 45
45 -
 46
46 -
 47
47 -
 48
48 -
 49
49 -
 50
50 -
 51
51 -
 52
52 -
 53
53 -
 54
54 -
 55
55 -
 56
56 -
 57
57 -
 58
58 -
 59
59 -
 60
60 -
 61
61 -
 62
62 -
 63
63 -
64
-
65
-
66
-
67
-
68
-
69
-
70
-
71
-
72
-
73
-
74
-
75
-
76
-
77
-
78
-
79
-
80
-
81
-
82
-
83
-
84
-
85
-
86
-
87
-
88
-
89
-
90
-
91
-
92
-
93
-
94
-
95
-
96
-
97
-
98
-
99
-
100
-
101
-
102
-
103
-
104
-
105
-
106
-
107
-
108
-
109
-
110
-
111
-
112
-
113
-
114
-
115
-
116
-
117
-
118
-
119
-
120
-
121
-
122
-
123
-
124
-
125
-
126
-
127
-
128
-
129
-
130
-
131
-
132
-
133
-
134
-
135
-
136
-
137
-
138
-
139
-
140
-
141
-
142
-
143
-
144
-
145
-
146
-
147
-
148
-
149
-
150
-
151
-
152
-
153
-
154
-
155
-
156
-
157
-
158
-
159
-
160
-
161
-
162
-
163
-
164
-
165
-
166
-
167
-
168
-
169
-
170
-
171
-
172
-
173
-
174
-
175
-
176
-
177
-
178
-
179
-
180
-
181
-
182
-
183
-
184
-
185
-
186
-
187
-
188
-
189
-
190
-
191
-
192
-
193
-
194
-
195
-
196
-
197
-
198
-
199
-
200
-
201
-
202
-
203
-
204
-
205
-
206
-
207
-
208
-
209
-
210
-
211
-
212
-
213
-
214
-
215
-
216
-
217
-
218
-
219
-
220
-
221
-
222
-
223
-
224
-
225
-
226
-
227
-
228
-
229
-
230
-
231
-
232
-
233
-
234
-
235
-
236
-
237
-
238
-
239
-
240
-
241
-
242
-
243
-
244
-
245
-
246
-
247
-
248
-
249
-
250
-
251
-
252
-
253
-
254
-
255
-
256
-
257
-
258
-
259
-
260
-
261
-
262
-
263
-
264
-
265
-
266
-
267
 |
 |

53
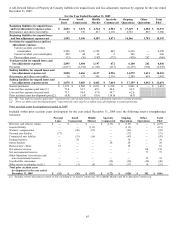
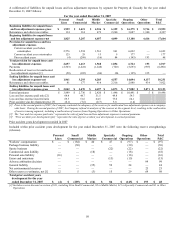
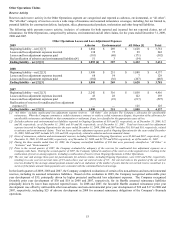
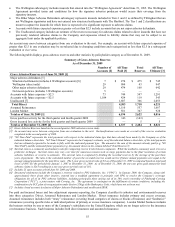
Other Operations Claims
Reserve Activity
Reserves and reserve activity in the Other Operations segment are categorized and reported as asbestos, environmental, or “all other”.
The “all other” category of reserves covers a wide range of insurance and assumed reinsurance coverages, including, but not limited to,
potential liability for construction defects, lead paint, silica, pharmaceutical products, molestation and other long-tail liabilities.
The following table presents reserve activity, inclusive of estimates for both reported and incurred but not reported claims, net of
reinsurance, for Other Operations, categorized by asbestos, environmental and all other claims, for the years ended December 31, 2009,
2008 and 2007.
Other Operations Losses and Loss Adjustment Expenses
2009 Asbestos Environmental All Other [1] Total
Beginning liability – net [2] [3] $ 1,884 $ 269 $ 1,628 $ 3,781
Losses and loss adjustment expenses incurred 138 75 29 242
Losses and loss adjustment expenses paid (181) (40) (171) (392)
Reclassification of asbestos and environmental liabilities[4] 51 3 (54) —
Ending liability – net [2] [3] $ 1,892 [6] $ 307 $ 1,432 $ 3,631
2008
Beginning liability – net [2] [3] $ 1,998 $ 251 $ 1,888 $ 4,137
Losses and loss adjustment expenses incurred 68 54 7 129
Losses and loss adjustment expenses paid (182) (36) (267) (485)
Ending liability – net [2] [3] $ 1,884 $ 269 $ 1,628 $ 3,781
2007
Beginning liability – net [2] [3] $ 2,242 $ 316 $ 1,858 $ 4,416
Losses and loss adjustment expenses incurred 43 28 122 193
Losses and loss adjustment expenses paid
Reallocation of reserves for unallocated loss adjustment
expenses [5]
(287)
—
(93)
—
(217)
125
(597)
125
Ending liability – net [2] [3] $ 1,998 $ 251 $ 1,888 $ 4,137
[1] “All Other” includes unallocated loss adjustment expense reserves. “All Other” also includes The Company’s allowance for uncollectible
reinsurance. When the Company commutes a ceded reinsurance contract or settles a ceded reinsurance dispute, the portion of the allowance for
uncollectible reinsurance attributable to that commutation or settlement, if any, is reclassified to the appropriate cause of loss.
[2] Excludes asbestos and environmental net liabilities reported in Ongoing Operations of $10 and $5, respectively, as of December 31, 2009, $12
and $6, respectively, as of December 31, 2008, and $9 and $6, respectively, as of December 31, 2007. Total net losses and loss adjustment
expenses incurred in Ongoing Operations for the years ended December 31, 2009, 2008 and 2007 includes $16, $16 and $10, respectively, related
to asbestos and environmental claims. Total net losses and loss adjustment expenses paid in Ongoing Operations for the years ended December
31, 2009, 2008 and 2007 includes $19, $13 and $10, respectively, related to asbestos and environmental claims.
[3] Gross of reinsurance, asbestos and environmental reserves, including liabilities in Ongoing Operations, were $2,484 and $367, respectively, as of
December 31, 2009, $2,498 and $309, respectively, as of December 31, 2008, and $2,707 and $290, respectively, as of December 31, 2007.
[4] During the three months ended June 30, 2009, the Company reclassified liabilities of $54 that were previously classified as “All Other” to
“Asbestos” and “Environmental”.
[5] Prior to the second quarter of 2007, the Company evaluated the adequacy of the reserves for unallocated loss adjustment expenses on a
Company-wide basis. During the second quarter of 2007, the Company refined its analysis of the reserves at the segment level, resulting in the
reallocation of reserves among segments, including a reallocation of reserves from Ongoing Operations to Other Operations.
[6] The one year and average three-year net paid amounts for asbestos claims, including Ongoing Operations, were $192 and $224, respectively,
resulting in a one year net survival ratio of 9.9 and a three year net survival ratio of 8.5. Net survival ratio is the quotient of the net carried
reserves divided by the average annual payment amount and is an indication of the number of years that the net carried reserve would last (i.e.
survive) if the future annual claim payments were consistent with the calculated historical average.
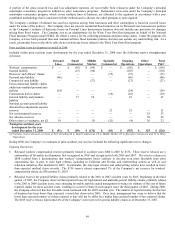
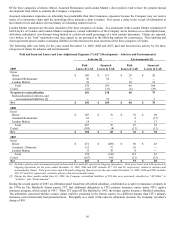
In the fourth quarters of 2009, 2008 and 2007, the Company completed evaluations of certain of its non-asbestos and non-environmental
reserves, including its assumed reinsurance liabilities. Based on this evaluation in 2009, the Company recognized unfavorable prior
year development of $35, principally driven by higher projected unallocated loss adjustment expenses. The Company recognized
favorable prior year development of $30 and $18 in 2008 and 2007, respectively, for its HartRe assumed reinsurance liabilities
principally driven by lower than expected reported losses. In 2008 and 2007, the favorable HartRe assumed reinsurance prior year
development was offset by unfavorable other non-asbestos and non-environmental prior year development of $30 and $17 in 2008 and
2007, respectively, including $25 of adverse development in 2008 for assumed reinsurance obligations of the Company’ s Bermuda
operations.