The Hartford 2009 Annual Report Download - page 109
Download and view the complete annual report
Please find page 109 of the 2009 The Hartford annual report below. You can navigate through the pages in the report by either clicking on the pages listed below, or by using the keyword search tool below to find specific information within the annual report.-
 1
1 -
2
-
3
-
4
-
5
-
6
-
7
-
8
-
9
-
10
-
11
-
12
-
13
-
14
-
15
-
16
-
17
-
18
-
19
-
20
-
21
-
22
-
23
-
24
-
25
-
26
-
27
-
28
-
29
-
30
-
31
-
32
-
33
-
34
-
35
-
36
-
37
-
38
-
39
-
40
-
41
-
42
-
43
-
44
-
45
-
46
-
47
-
48
-
49
-
50
-
51
-
52
-
53
-
54
-
55
-
56
-
57
-
58
-
59
-
60
-
61
-
62
-
63
-
64
-
65
-
66
-
67
-
68
-
69
-
70
-
71
-
72
-
73
-
74
-
75
-
76
-
77
-
78
-
79
-
80
-
81
-
82
-
83
-
84
-
85
-
86
-
87
-
88
-
89
-
90
-
91
-
92
-
93
-
94
-
95
-
96
-
97
-
98
-
 99
99 -
 100
100 -
 101
101 -
 102
102 -
 103
103 -
 104
104 -
 105
105 -
 106
106 -
 107
107 -
 108
108 -
 109
109 -
 110
110 -
 111
111 -
 112
112 -
 113
113 -
 114
114 -
 115
115 -
 116
116 -
 117
117 -
 118
118 -
 119
119 -
120
-
121
-
122
-
123
-
124
-
125
-
126
-
127
-
128
-
129
-
130
-
131
-
132
-
133
-
134
-
135
-
136
-
137
-
138
-
139
-
140
-
141
-
142
-
143
-
144
-
145
-
146
-
147
-
148
-
149
-
150
-
151
-
152
-
153
-
154
-
155
-
156
-
157
-
158
-
159
-
160
-
161
-
162
-
163
-
164
-
165
-
166
-
167
-
168
-
169
-
170
-
171
-
172
-
173
-
174
-
175
-
176
-
177
-
178
-
179
-
180
-
181
-
182
-
183
-
184
-
185
-
186
-
187
-
188
-
189
-
190
-
191
-
192
-
193
-
194
-
195
-
196
-
197
-
198
-
199
-
200
-
201
-
202
-
203
-
204
-
205
-
206
-
207
-
208
-
209
-
210
-
211
-
212
-
213
-
214
-
215
-
216
-
217
-
218
-
219
-
220
-
221
-
222
-
223
-
224
-
225
-
226
-
227
-
228
-
229
-
230
-
231
-
232
-
233
-
234
-
235
-
236
-
237
-
238
-
239
-
240
-
241
-
242
-
243
-
244
-
245
-
246
-
247
-
248
-
249
-
250
-
251
-
252
-
253
-
254
-
255
-
256
-
257
-
258
-
259
-
260
-
261
-
262
-
263
-
264
-
265
-
266
-
267
 |
 |

109
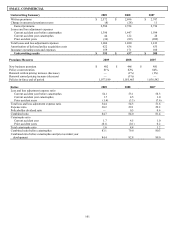
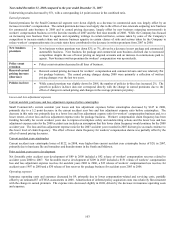
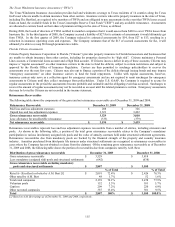
• Within the “Other” category, earned premium remained relatively flat from 2007 to 2008. The “Other” category of earned
premiums includes premiums assumed under inter-segment arrangements.
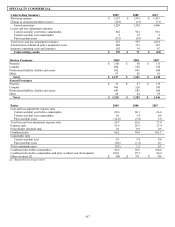
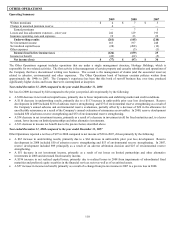
Losses and loss adjustment expenses
Current accident year losses and loss adjustment expenses before catastrophes
Specialty Commercial current accident year losses and loss adjustment expenses before catastrophes decreased by $20, due to a
decrease in earned premium, partially offset by an increase in the loss and loss adjustment expense ratio before catastrophes and prior
accident year development. The loss and loss adjustment expense ratio before catastrophes and prior accident year development
increased by 1.5 points, primarily due to a higher loss and loss adjustment expense ratio for directors and officers insurance in
professional liability, driven by earned pricing decreases, and a lower mix of property business which has a lower loss and loss
adjustment ratio than other businesses within Specialty Commercial.
Current accident year catastrophe losses
Current accident year catastrophe losses increased $38, primarily due to losses from hurricane Ike.
Prior accident year reserve development
Prior accident year reserve development changed from net unfavorable prior accident year reserve development of $84 in 2007 to net
favorable prior accident year reserve development of $81 in 2008. Net favorable prior accident year reserve development in 2008
primarily included a $75 release of reserves for directors’ and officers insurance and errors and omissions insurance claims related to
accident years 2003 to 2006.
Prior accident year reserve development in 2007 consisted primarily of a $47 strengthening of workers’ compensation loss and loss
adjustment expense reserves for accident years 1987 to 2001, a $34 strengthening of general liability reserves, primarily related to
accident years 1987 to 1997, and a $25 strengthening of general liability reserves for accident years more than 20 years old. Partially
offsetting the unfavorable reserve development in 2007 was a $22 release of reserves for surety business for accident years 2003 to
2006.
Operating expenses
Amortization of deferred policy acquisition costs decreased by $10 due to the decrease in earned premium, partially offset by the effect
of an increase in net acquisition costs related to writing a greater mix of higher net commission small commercial and private directors’
and officers’ insurance. Insurance operating costs and expenses increased by $4, primarily due to an increase in IT costs. The expense
ratio increased by 0.9 points, primarily due to the increase in insurance operating costs and expenses, the increase in net acquisition
costs for directors’ and officers’ insurance and the effect of the decrease in earned premium.