The Hartford 2009 Annual Report Download - page 123
Download and view the complete annual report
Please find page 123 of the 2009 The Hartford annual report below. You can navigate through the pages in the report by either clicking on the pages listed below, or by using the keyword search tool below to find specific information within the annual report.-
 1
1 -
2
-
3
-
4
-
5
-
6
-
7
-
8
-
9
-
10
-
11
-
12
-
13
-
14
-
15
-
16
-
17
-
18
-
19
-
20
-
21
-
22
-
23
-
24
-
25
-
26
-
27
-
28
-
29
-
30
-
31
-
32
-
33
-
34
-
35
-
36
-
37
-
38
-
39
-
40
-
41
-
42
-
43
-
44
-
45
-
46
-
47
-
48
-
49
-
50
-
51
-
52
-
53
-
54
-
55
-
56
-
57
-
58
-
59
-
60
-
61
-
62
-
63
-
64
-
65
-
66
-
67
-
68
-
69
-
70
-
71
-
72
-
73
-
74
-
75
-
76
-
77
-
78
-
79
-
80
-
81
-
82
-
83
-
84
-
85
-
86
-
87
-
88
-
89
-
90
-
91
-
92
-
93
-
94
-
95
-
96
-
97
-
98
-
99
-
100
-
101
-
102
-
103
-
104
-
105
-
106
-
107
-
108
-
109
-
110
-
111
-
112
-
 113
113 -
 114
114 -
 115
115 -
 116
116 -
 117
117 -
 118
118 -
 119
119 -
 120
120 -
 121
121 -
 122
122 -
 123
123 -
 124
124 -
 125
125 -
 126
126 -
 127
127 -
 128
128 -
 129
129 -
 130
130 -
 131
131 -
 132
132 -
 133
133 -
134
-
135
-
136
-
137
-
138
-
139
-
140
-
141
-
142
-
143
-
144
-
145
-
146
-
147
-
148
-
149
-
150
-
151
-
152
-
153
-
154
-
155
-
156
-
157
-
158
-
159
-
160
-
161
-
162
-
163
-
164
-
165
-
166
-
167
-
168
-
169
-
170
-
171
-
172
-
173
-
174
-
175
-
176
-
177
-
178
-
179
-
180
-
181
-
182
-
183
-
184
-
185
-
186
-
187
-
188
-
189
-
190
-
191
-
192
-
193
-
194
-
195
-
196
-
197
-
198
-
199
-
200
-
201
-
202
-
203
-
204
-
205
-
206
-
207
-
208
-
209
-
210
-
211
-
212
-
213
-
214
-
215
-
216
-
217
-
218
-
219
-
220
-
221
-
222
-
223
-
224
-
225
-
226
-
227
-
228
-
229
-
230
-
231
-
232
-
233
-
234
-
235
-
236
-
237
-
238
-
239
-
240
-
241
-
242
-
243
-
244
-
245
-
246
-
247
-
248
-
249
-
250
-
251
-
252
-
253
-
254
-
255
-
256
-
257
-
258
-
259
-
260
-
261
-
262
-
263
-
264
-
265
-
266
-
267
 |
 |

123
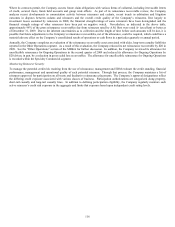
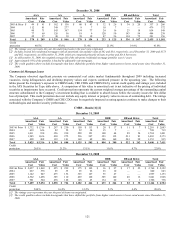
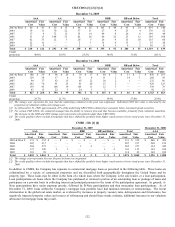
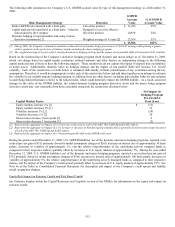
Commercial Mortgage Loans
December 31, 2009 December 31, 2008
Amortized
Cost [1]
Valuation
Allowance
Carrying
Value
Amortized
Cost [1]
Valuation
Allowance
Carrying
Value
Whole loans $ 3,319 $ (40) $ 3,279 $ 3,557 $ (2) $ 3,555
A-Note participations 391 — 391 460 (13) 447
B-Note participations 701 (176) 525 724 –– 724
Mezzanine loans 1,081 (142) 939 1,108 –– 1,108
Total [2] $ 5,492 $ (358) $ 5,134 $ 5,849 $ (15) $ 5,834
[1] Amortized cost represents carrying value prior to valuation allowances, if any.
[2] Excludes agricultural and residential mortgage loans. For further information on the total mortgage loan portfolio, see Note 5 of the Notes to
Consolidated Financial Statements.
Included in the table above are valuation allowances on mortgage loans held for sale associated with B-note participations and
mezzanine loans of $51 and $43, respectively, which had a carrying value of $47 and $96, respectively, as of December 31, 2009.
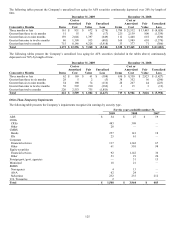
At origination, the weighted average loan-to-value (“LTV”) rate of the Company’ s commercial mortgage loan portfolio was
approximately 63%. As of December 31, 2009, the current weighted average LTV rate was approximately 83%. LTV rates compare
the loan amount to the value of the underlying property collateralizing the loan. The loan values are updated periodically through
property level reviews of the portfolio. Factors considered in the property valuation include, but are not limited to, actual and expected
property cash flows, geographic market data and capitalization rates.
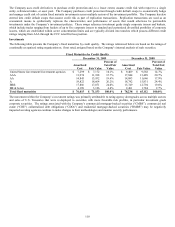
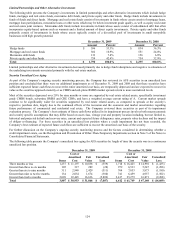
ABS Consumer Loans
The following table presents the Company’ s exposure to ABS consumer loans by credit quality, included in the AFS Securities by Type
table above. Currently, the Company expects its ABS consumer loan holdings will continue to pay contractual principal and interest
payments due to the ultimate expected borrower repayment performance and structural credit enhancements, which remain sufficient to
absorb a significantly higher level of defaults than are currently anticipated.
December 31, 2009
AAA AA A BBB
BB and Below Total
Amortized
Cost
Fair
Value
Amortized
Cost
Fair
Value
Amortized
Cost
Fair
Value
Amortized
Cost
Fair
Value
Amortized
Cost
Fair
Value
Amortized
Cost
Fair
Value
Auto [1] $ 136 $ 137 $ 47 $ 47 $ 96 $ 96 $ 105 $ 103 $ 22 $ 17 $ 406 $ 400
Credit card 703 714 — — 26 24 197 186 — — 926 924
Student loan [2] 292 186 326 249 137 66 — — — — 755 501
Total [3] $ 1,131 $ 1,037 $ 373 $ 296 $ 259 $ 186 $ 302 $ 289 $ 22 $ 17 $ 2,087 $ 1,825
December 31, 2008
AAA AA A BBB
BB and Below Total
Amortized
Cost
Fair
Value
Amortized
Cost
Fair
Value
Amortized
Cost
Fair
Value
Amortized
Cost
Fair
Value
Amortized
Cost
Fair
Value
Amortized
Cost
Fair
Value
Auto $ 135 $ 109 $ 29 $ 27 $ 142 $ 103 $ 209 $ 162 $ 30 $ 20 $ 545 $ 421
Credit card 419 367 6 3 108 97 351 248 58 39 942 754
Student loan 294 159 332 244 138 84 — — — — 764 487
Total $ 848 $ 635 $ 367 $ 274 $ 388 $ 284 $ 560 $ 410 $ 88 $ 59 $ 2,251 $ 1,662
[1] As of December 31, 2009, approximately 8% of the auto consumer loan-backed securities were issued by lenders whose primary business is to
sub-prime borrowers.
[2] As of December 31, 2009, approximately half of the student loan-backed exposure is guaranteed by the Federal Family Education Loan Program,
with the remainder comprised of loans to prime borrowers.
[3] The credit qualities above include downgrades that have shifted the portfolio from higher rated assets to lower rated assets since December 31,
2008.
Municipal Bonds
The Company has investments in securities backed by states, municipalities and political subdivisions issuers (“municipal”) with an
amortized cost and fair value of $12.1 billion as of December 31, 2009 and $11.4 billion and $10.7 billion, respectively, as of December
31, 2008. The Company’ s municipal bond portfolio is diversified across the United States and primarily consists of general obligation
and revenue bonds issued by states, cities, counties, school districts and similar issuers. As of December 31, 2009, the largest
concentrations were in California, Georgia and Illinois which each comprised less than 3% of the municipal bond portfolio and were
primarily comprised of general obligation securities. Certain of the Company’ s municipal bonds were enhanced by third-party
insurance for the payment of principal and interest in the event of an issuer default. Excluding the benefit of this insurance, the average
credit rating was AA- and AA, respectively, as of December 31, 2009 and 2008.