The Hartford 2009 Annual Report Download - page 87
Download and view the complete annual report
Please find page 87 of the 2009 The Hartford annual report below. You can navigate through the pages in the report by either clicking on the pages listed below, or by using the keyword search tool below to find specific information within the annual report.-
 1
1 -
2
-
3
-
4
-
5
-
6
-
7
-
8
-
9
-
10
-
11
-
12
-
13
-
14
-
15
-
16
-
17
-
18
-
19
-
20
-
21
-
22
-
23
-
24
-
25
-
26
-
27
-
28
-
29
-
30
-
31
-
32
-
33
-
34
-
35
-
36
-
37
-
38
-
39
-
40
-
41
-
42
-
43
-
44
-
45
-
46
-
47
-
48
-
49
-
50
-
51
-
52
-
53
-
54
-
55
-
56
-
57
-
58
-
59
-
60
-
61
-
62
-
63
-
64
-
65
-
66
-
67
-
68
-
69
-
70
-
71
-
72
-
73
-
74
-
75
-
76
-
 77
77 -
 78
78 -
 79
79 -
 80
80 -
 81
81 -
 82
82 -
 83
83 -
 84
84 -
 85
85 -
 86
86 -
 87
87 -
 88
88 -
 89
89 -
 90
90 -
 91
91 -
 92
92 -
 93
93 -
 94
94 -
 95
95 -
 96
96 -
 97
97 -
98
-
99
-
100
-
101
-
102
-
103
-
104
-
105
-
106
-
107
-
108
-
109
-
110
-
111
-
112
-
113
-
114
-
115
-
116
-
117
-
118
-
119
-
120
-
121
-
122
-
123
-
124
-
125
-
126
-
127
-
128
-
129
-
130
-
131
-
132
-
133
-
134
-
135
-
136
-
137
-
138
-
139
-
140
-
141
-
142
-
143
-
144
-
145
-
146
-
147
-
148
-
149
-
150
-
151
-
152
-
153
-
154
-
155
-
156
-
157
-
158
-
159
-
160
-
161
-
162
-
163
-
164
-
165
-
166
-
167
-
168
-
169
-
170
-
171
-
172
-
173
-
174
-
175
-
176
-
177
-
178
-
179
-
180
-
181
-
182
-
183
-
184
-
185
-
186
-
187
-
188
-
189
-
190
-
191
-
192
-
193
-
194
-
195
-
196
-
197
-
198
-
199
-
200
-
201
-
202
-
203
-
204
-
205
-
206
-
207
-
208
-
209
-
210
-
211
-
212
-
213
-
214
-
215
-
216
-
217
-
218
-
219
-
220
-
221
-
222
-
223
-
224
-
225
-
226
-
227
-
228
-
229
-
230
-
231
-
232
-
233
-
234
-
235
-
236
-
237
-
238
-
239
-
240
-
241
-
242
-
243
-
244
-
245
-
246
-
247
-
248
-
249
-
250
-
251
-
252
-
253
-
254
-
255
-
256
-
257
-
258
-
259
-
260
-
261
-
262
-
263
-
264
-
265
-
266
-
267
 |
 |

87
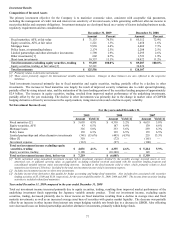
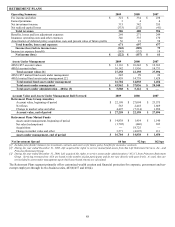
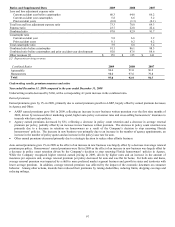
Year ended December 31, 2009 compared to the year ended December 31, 2008
The increase in net income for the year ended December 31, 2009, was primarily due to lower net realized capital losses in 2009. The
following other factors contributed to the changes in net income:
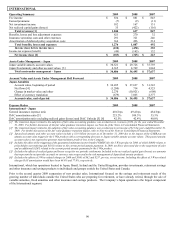
Premiums and other
considerations
• Premiums and other considerations decreased primarily due to reductions in covered lives within our
customer base.
Net investment
income
• Net investment income decreased primarily as a result of lower yields on fixed maturity investments.
Net realized capital
losses
• Lower net realized capital losses were primarily driven by fewer impairments in 2009 compared to 2008.
For further discussion on impairments, see Other-Than-Temporary Impairments within the Investment
Credit Risk section of the MD&A.
Loss ratio • The segment’ s loss ratio increased primarily due to unfavorable morbidity experience, which was
primarily due to unfavorable reserve development from the 2008 incurral loss year and higher new
incurred long-term disability claims in 2009.
Expense ratio • The segment’ s expense ratio, excluding buyouts increased compared to the prior year due primarily to a
commission accrual adjustment recorded in 2009 on financial institutions business.
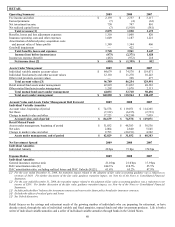
Income tax expense
(benefit)
• Income tax expense increased as a result of improved earnings before income taxes primarily due to
lower net realized capital losses. The effective tax rate for 2009 differs from the statutory rate of 35%
primarily due to investments in tax exempt securities.
Fully insured
ongoing sales,
excluding buyouts
• Fully insured ongoing sales, excluding buyouts, decreased in 2009 from 2008 primarily due to the
competitive marketplace and economic environment.
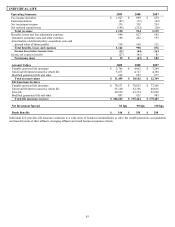
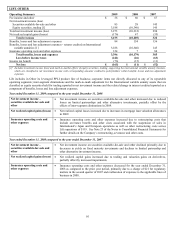
Year ended December 31, 2008 compared to the year ended December 31, 2007
The decrease in net income for the year ended December 31, 2008, was primarily due to increased net realized capital losses.
Premiums and other
considerations
• Premiums and other considerations increased largely due to business growth driven by new sales and
persistency over the last twelve months.
Net investment
income
• Net investment income decreased primarily as a result of lower yields on fixed maturity investments and
lower limited partnership and other alternative investment returns of $33.
Net realized capital
losses
• Higher net realized capital losses were primarily driven by higher impairments in 2008 compared to
2007. For further discussion on impairments, see Other-Than-Temporary Impairments within the
Investment Credit Risk section of the MD&A.
Loss ratio • The segment’ s loss ratio decreased due to favorable disability and medical stop loss experience partially
offset by unfavorable mortality.
Expense ratio • The segment’ s expense ratio, excluding buyouts decreased compared to the prior year due primarily to
lower commission expenses.
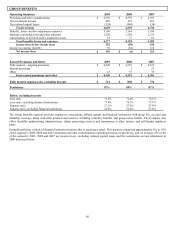
Income tax expense
(benefit)
• 2008 had an income tax benefit compared to an income tax expense in 2007 as a result of higher net
realized capital losses. The effective tax rate for 2008 differs from the statutory rate of 35% primarily
due to investments in tax exempt securities.