The Hartford 2009 Annual Report Download - page 11
Download and view the complete annual report
Please find page 11 of the 2009 The Hartford annual report below. You can navigate through the pages in the report by either clicking on the pages listed below, or by using the keyword search tool below to find specific information within the annual report.-
 1
1 -
 2
2 -
 3
3 -
 4
4 -
 5
5 -
 6
6 -
 7
7 -
 8
8 -
 9
9 -
 10
10 -
 11
11 -
 12
12 -
 13
13 -
 14
14 -
 15
15 -
 16
16 -
 17
17 -
 18
18 -
 19
19 -
 20
20 -
 21
21 -
 22
22 -
23
-
24
-
25
-
26
-
27
-
28
-
29
-
30
-
31
-
32
-
33
-
34
-
35
-
36
-
37
-
38
-
39
-
40
-
41
-
42
-
43
-
44
-
45
-
46
-
47
-
48
-
49
-
50
-
51
-
52
-
53
-
54
-
55
-
56
-
57
-
58
-
59
-
60
-
61
-
62
-
63
-
64
-
65
-
66
-
67
-
68
-
69
-
70
-
71
-
72
-
73
-
74
-
75
-
76
-
77
-
78
-
79
-
80
-
81
-
82
-
83
-
84
-
85
-
86
-
87
-
88
-
89
-
90
-
91
-
92
-
93
-
94
-
95
-
96
-
97
-
98
-
99
-
100
-
101
-
102
-
103
-
104
-
105
-
106
-
107
-
108
-
109
-
110
-
111
-
112
-
113
-
114
-
115
-
116
-
117
-
118
-
119
-
120
-
121
-
122
-
123
-
124
-
125
-
126
-
127
-
128
-
129
-
130
-
131
-
132
-
133
-
134
-
135
-
136
-
137
-
138
-
139
-
140
-
141
-
142
-
143
-
144
-
145
-
146
-
147
-
148
-
149
-
150
-
151
-
152
-
153
-
154
-
155
-
156
-
157
-
158
-
159
-
160
-
161
-
162
-
163
-
164
-
165
-
166
-
167
-
168
-
169
-
170
-
171
-
172
-
173
-
174
-
175
-
176
-
177
-
178
-
179
-
180
-
181
-
182
-
183
-
184
-
185
-
186
-
187
-
188
-
189
-
190
-
191
-
192
-
193
-
194
-
195
-
196
-
197
-
198
-
199
-
200
-
201
-
202
-
203
-
204
-
205
-
206
-
207
-
208
-
209
-
210
-
211
-
212
-
213
-
214
-
215
-
216
-
217
-
218
-
219
-
220
-
221
-
222
-
223
-
224
-
225
-
226
-
227
-
228
-
229
-
230
-
231
-
232
-
233
-
234
-
235
-
236
-
237
-
238
-
239
-
240
-
241
-
242
-
243
-
244
-
245
-
246
-
247
-
248
-
249
-
250
-
251
-
252
-
253
-
254
-
255
-
256
-
257
-
258
-
259
-
260
-
261
-
262
-
263
-
264
-
265
-
266
-
267
 |
 |

11
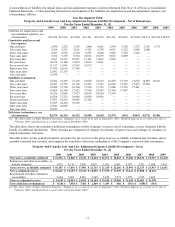
A reconciliation of liabilities for unpaid losses and loss adjustment expenses is herein referenced from Note 11 of Notes to Consolidated
Financial Statements. A table depicting the historical development of the liabilities for unpaid losses and loss adjustment expenses, net
of reinsurance, follows.
Loss Development Table
Property And Casualty Loss And Loss Adjustment Expense Liability Development - Net of Reinsurance
For the Years Ended December 31, [1]
1999 2000 2001 2002 2003 2004 2005 2006 2007 2008 2009
Liabilities for unpaid losses and
loss adjustment expenses, net
of reinsurance
$12,476
$12,316 $12,860 $13,141 $16,218 $16,191
$16,863
$17,604 $18,231 $18,347
$18,210
Cumulative paid losses and
loss expenses
One year later 2,994 3,272 3,339 3,480 4,415 3,594 3,702 3,727 3,703 3,771
Two years later 5,019 5,315 5,621 6,781 6,779 6,035 6,122 5,980 5,980
Three years later 6,437 6,972 8,324 8,591 8,686 7,825 7,755 7,544 —
Four years later 7,652 9,195 9,710 10,061 10,075 9,045 8,889 — —
Five years later 9,567 10,227 10,871 11,181 11,063 9,928 — — —
Six years later 10,376 11,140 11,832 12,015 11,821 — — — —
Seven years later 11,137 11,961 12,563 12,672 — — — — —
Eight years later 11,856 12,616 13,166 — — — — — —
Nine years later 12,432 13,167 — — — — — — —
Ten years later 12,939 — — — — — — — —
Liabilities re-estimated
One year later 12,472 12,459 13,153 15,965 16,632 16,439 17,159 17,652 18,005 18,161
Two years later 12,527 12,776 16,176 16,501 17,232 16,838 17,347 17,475 17,858
Three years later 12,698 15,760 16,768 17,338 17,739 17,240 17,318 17,441 —
Four years later 15,609 16,584 17,425 17,876 18,367 17,344 17,497 — —
Five years later 16,256 17,048 17,927 18,630 18,554 17,570 — — —
Six years later 16,568 17,512 18,686 18,838 18,836 — — — —
Seven years later 17,031 18,216 18,892 19,126 — — — — —
Eight years later 17,655 18,410 19,192 — — — — — —
Nine years later 17,841 18,649 — — — — — — —
Ten years later 18,055 — — — — — — — —
Deficiency (redundancy), net
of reinsurance
$5,579
$6,333 $6,332 $5,985 $2,618 $1,379
$634
$(163) $(373) $(186)
[1] The above table excludes Hartford Insurance, Singapore as a result of its sale in September 2001; Hartford Seguros as a result of its sale in
February 2001; and Zwolsche as a result of its sale in December 2000.
The table above shows the cumulative deficiency (redundancy) of the Company’ s reserves, net of reinsurance, as now estimated with the
benefit of additional information. Those amounts are comprised of changes in estimates of gross losses and changes in estimates of
related reinsurance recoveries.
The table below, for the periods presented, reconciles the net reserves to the gross reserves, as initially estimated and recorded, and as
currently estimated and recorded, and computes the cumulative deficiency (redundancy) of the Company’ s reserves before reinsurance.
Property And Casualty Loss And Loss Adjustment Expense Liability Development - Gross
For the Years Ended December 31, [1]
2000 2001 2002 2003 2004 2005 2006 2007 2008 2009
Net reserve, as initially estimated $ 12,316 $ 12,860 $13,141 $16,218 $16,191 $16,863 $ 17,604 $ 18,231 $18,347 $18,210
Reinsurance and other recoverables, as
initially estimated
3,871
4,176
3,950
5,497
5,138
5,403
4,387
3,922
3,586
3,441
Gross reserve, as initially estimated $ 16,187 $ 17,036 $17,091 $21,715 $21,329 $22,266 $ 21,991 $ 22,153 $21,933 $21,651
Net re-estimated reserve $ 18,649 $ 19,192 $19,126 $18,836 $17,570 $17,497 $ 17,441 $ 17,858 $18,161
Re-estimated and other reinsurance
recoverables 5,644 5,802
5,426 5,348
5,250
5,571 3,997
3,745 3,409
Gross re-estimated reserve $ 24,293 $ 24,994 $24,552 $24,184 $22,820 $23,068 $ 21,438 $ 21,603 $21,570
Gross deficiency (redundancy) $ 8,106 $ 7,958 $7,461 $2,469 $1,491 $ 802 $ (553) $ (550) $(363)
[1] The above table excludes Hartford Insurance, Singapore as a result of its sale in September 2001; Hartford Seguros as a result of its sale in
February 2001; and Zwolsche as a result of its sale in December 2000.