The Hartford 2009 Annual Report Download - page 177
Download and view the complete annual report
Please find page 177 of the 2009 The Hartford annual report below. You can navigate through the pages in the report by either clicking on the pages listed below, or by using the keyword search tool below to find specific information within the annual report.-
 1
1 -
2
-
3
-
4
-
5
-
6
-
7
-
8
-
9
-
10
-
11
-
12
-
13
-
14
-
15
-
16
-
17
-
18
-
19
-
20
-
21
-
22
-
23
-
24
-
25
-
26
-
27
-
28
-
29
-
30
-
31
-
32
-
33
-
34
-
35
-
36
-
37
-
38
-
39
-
40
-
41
-
42
-
43
-
44
-
45
-
46
-
47
-
48
-
49
-
50
-
51
-
52
-
53
-
54
-
55
-
56
-
57
-
58
-
59
-
60
-
61
-
62
-
63
-
64
-
65
-
66
-
67
-
68
-
69
-
70
-
71
-
72
-
73
-
74
-
75
-
76
-
77
-
78
-
79
-
80
-
81
-
82
-
83
-
84
-
85
-
86
-
87
-
88
-
89
-
90
-
91
-
92
-
93
-
94
-
95
-
96
-
97
-
98
-
99
-
100
-
101
-
102
-
103
-
104
-
105
-
106
-
107
-
108
-
109
-
110
-
111
-
112
-
113
-
114
-
115
-
116
-
117
-
118
-
119
-
120
-
121
-
122
-
123
-
124
-
125
-
126
-
127
-
128
-
129
-
130
-
131
-
132
-
133
-
134
-
135
-
136
-
137
-
138
-
139
-
140
-
141
-
142
-
143
-
144
-
145
-
146
-
147
-
148
-
149
-
150
-
151
-
152
-
153
-
154
-
155
-
156
-
157
-
158
-
159
-
160
-
161
-
162
-
163
-
164
-
165
-
166
-
 167
167 -
 168
168 -
 169
169 -
 170
170 -
 171
171 -
 172
172 -
 173
173 -
 174
174 -
 175
175 -
 176
176 -
 177
177 -
 178
178 -
 179
179 -
 180
180 -
 181
181 -
 182
182 -
 183
183 -
 184
184 -
 185
185 -
 186
186 -
 187
187 -
188
-
189
-
190
-
191
-
192
-
193
-
194
-
195
-
196
-
197
-
198
-
199
-
200
-
201
-
202
-
203
-
204
-
205
-
206
-
207
-
208
-
209
-
210
-
211
-
212
-
213
-
214
-
215
-
216
-
217
-
218
-
219
-
220
-
221
-
222
-
223
-
224
-
225
-
226
-
227
-
228
-
229
-
230
-
231
-
232
-
233
-
234
-
235
-
236
-
237
-
238
-
239
-
240
-
241
-
242
-
243
-
244
-
245
-
246
-
247
-
248
-
249
-
250
-
251
-
252
-
253
-
254
-
255
-
256
-
257
-
258
-
259
-
260
-
261
-
262
-
263
-
264
-
265
-
266
-
267
 |
 |
THE HARTFORD FINANCIAL SERVICES GROUP, INC.
NOTES TO CONSOLIDATED FINANCIAL STATEMENTS (continued)
F-28
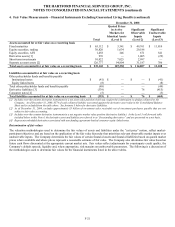
4a. Fair Value Measurements – Guaranteed Living Benefits (continued)
Product Derivatives
The Company currently offers certain variable annuity products with a guaranteed minimum withdrawal benefit (“GMWB”) rider in the
U.S., and formerly offered GMWBs in the U.K. and Japan. The GMWB represents an embedded derivative in the variable annuity
contract. When it is determined that (1) the embedded derivative possesses economic characteristics that are not clearly and closely
related to the economic characteristics of the host contract, and (2) a separate instrument with the same terms would qualify as a
derivative instrument, the embedded derivative is bifurcated from the host for measurement purposes. The embedded derivative, which
is reported with the host instrument in the consolidated balance sheets, is carried at fair value with changes in fair value reported in net
realized capital gains and losses. The Company's GMWB liability is reported in other policyholder funds.
In valuing the embedded derivative, the Company attributes to the derivative a portion of the fees collected from the contract holder
equal to the present value of future GMWB claims (the “Attributed Fees”). All changes in the fair value of the embedded derivative are
recorded in net realized capital gains and losses. The excess of fees collected from the contract holder over the Attributed Fees are
associated with the host variable annuity contract and reported in fee income.
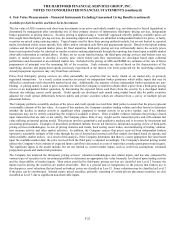
U.S. GMWB Reinsurance Derivative
The Company has reinsurance arrangements in place to transfer a portion of its risk of loss due to GMWB. These arrangements are
recognized as derivatives and carried at fair value in reinsurance recoverables. Changes in the fair value of the reinsurance agreements
are reported in net realized capital gains and losses.
The fair value of the U.S. GMWB reinsurance derivative is calculated as an aggregation of the components described in the Living
Benefits Required to be Fair Valued discussion below and is modeled using significant unobservable policyholder behavior inputs,
identical to those used in calculating the underlying liability, such as lapses, fund selection, resets and withdrawal utilization and risk
margins.
Adoption of Fair Value Accounting
The impact on January 1, 2008 of adopting fair value accounting for guaranteed benefits and the related reinsurance was a reduction to
net income of $220, after the effects of DAC amortization and income taxes.
Living Benefits Required to be Fair Valued (in Other Policyholder Funds and Benefits Payable)
Fair values for GMWB and guaranteed minimum accumulation benefit (“GMAB”) contracts are calculated based upon internally
developed models because active, observable markets do not exist for those items. The fair value of the Company’ s guaranteed benefit
liabilities, classified as embedded derivatives, and the related reinsurance and customized freestanding derivatives is calculated as an
aggregation of the following components: Best Estimate Claims Costs, calculated based on actuarial and capital market assumptions
related to projected cash flows over the lives of the contracts; Credit Standing Adjustment; and Margins, representing an amount that
market participants would require for the risk that the Company’ s assumptions about policyholder behavior could differ from actual
experience. The resulting aggregation is reconciled or calibrated, if necessary, to market information that is, or may be, available to the
Company, but may not be observable by other market participants, including reinsurance discussions and transactions. The Company
believes the aggregation of these components, as necessary and as reconciled or calibrated to the market information available to the
Company, results in an amount that the Company would be required to transfer or receive, for an asset, to or from market participants in
an active liquid market, if one existed, for those market participants to assume the risks associated with the guaranteed minimum
benefits and the related reinsurance and customized derivatives. The fair value is likely to materially diverge from the ultimate
settlement of the liability as the Company believes settlement will be based on our best estimate assumptions rather than those best
estimate assumptions plus risk margins. In the absence of any transfer of the guaranteed benefit liability to a third party, the release of
risk margins is likely to be reflected as realized gains in future periods’ net income. Each component is unobservable in the marketplace
and requires subjectivity by the Company in determining their value.
The Company recognized the following realized gains and losses due to updates to the living benefits models for the U.S. GMWB:
• The relative outperformance (underperformance) of the underlying actively managed funds as compared to their respective indices
resulting in a gain (loss) of approximately $550, $(355) and $(2) for the years ended December 31, 2009, 2008 and 2007,
respectively; and
• Assumption updates, including policyholder behavior assumptions, affected best estimates and margins for a total realized gain pre-
tax of $566 and $470 for the years ended December 31, 2009 and 2008, respectively. For the year ended December 31, 2007, these
updates affected best estimates resulting in a pre-tax loss of $(158).
• The credit standing adjustment, resulting in a pre-tax gain of approximately $154 and $6 for the years ended December 31, 2009
and 2008, respectively.