The Hartford 2009 Annual Report Download - page 227
Download and view the complete annual report
Please find page 227 of the 2009 The Hartford annual report below. You can navigate through the pages in the report by either clicking on the pages listed below, or by using the keyword search tool below to find specific information within the annual report.-
 1
1 -
2
-
3
-
4
-
5
-
6
-
7
-
8
-
9
-
10
-
11
-
12
-
13
-
14
-
15
-
16
-
17
-
18
-
19
-
20
-
21
-
22
-
23
-
24
-
25
-
26
-
27
-
28
-
29
-
30
-
31
-
32
-
33
-
34
-
35
-
36
-
37
-
38
-
39
-
40
-
41
-
42
-
43
-
44
-
45
-
46
-
47
-
48
-
49
-
50
-
51
-
52
-
53
-
54
-
55
-
56
-
57
-
58
-
59
-
60
-
61
-
62
-
63
-
64
-
65
-
66
-
67
-
68
-
69
-
70
-
71
-
72
-
73
-
74
-
75
-
76
-
77
-
78
-
79
-
80
-
81
-
82
-
83
-
84
-
85
-
86
-
87
-
88
-
89
-
90
-
91
-
92
-
93
-
94
-
95
-
96
-
97
-
98
-
99
-
100
-
101
-
102
-
103
-
104
-
105
-
106
-
107
-
108
-
109
-
110
-
111
-
112
-
113
-
114
-
115
-
116
-
117
-
118
-
119
-
120
-
121
-
122
-
123
-
124
-
125
-
126
-
127
-
128
-
129
-
130
-
131
-
132
-
133
-
134
-
135
-
136
-
137
-
138
-
139
-
140
-
141
-
142
-
143
-
144
-
145
-
146
-
147
-
148
-
149
-
150
-
151
-
152
-
153
-
154
-
155
-
156
-
157
-
158
-
159
-
160
-
161
-
162
-
163
-
164
-
165
-
166
-
167
-
168
-
169
-
170
-
171
-
172
-
173
-
174
-
175
-
176
-
177
-
178
-
179
-
180
-
181
-
182
-
183
-
184
-
185
-
186
-
187
-
188
-
189
-
190
-
191
-
192
-
193
-
194
-
195
-
196
-
197
-
198
-
199
-
200
-
201
-
202
-
203
-
204
-
205
-
206
-
207
-
208
-
209
-
210
-
211
-
212
-
213
-
214
-
215
-
216
-
 217
217 -
 218
218 -
 219
219 -
 220
220 -
 221
221 -
 222
222 -
 223
223 -
 224
224 -
 225
225 -
 226
226 -
 227
227 -
 228
228 -
 229
229 -
 230
230 -
 231
231 -
 232
232 -
 233
233 -
 234
234 -
 235
235 -
 236
236 -
 237
237 -
238
-
239
-
240
-
241
-
242
-
243
-
244
-
245
-
246
-
247
-
248
-
249
-
250
-
251
-
252
-
253
-
254
-
255
-
256
-
257
-
258
-
259
-
260
-
261
-
262
-
263
-
264
-
265
-
266
-
267
 |
 |

THE HARTFORD FINANCIAL SERVICES GROUP, INC.
NOTES TO CONSOLIDATED FINANCIAL STATEMENTS (continued)
F-78
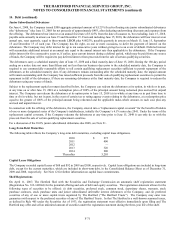
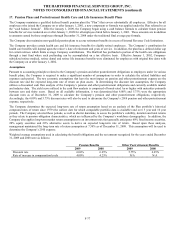
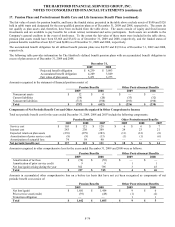
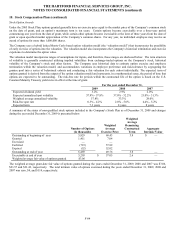
17. Pension Plans and Postretirement Health Care and Life Insurance Benefit Plans (continued)
Weighted average assumptions used in calculating the net periodic benefit cost for the Company’ s pension and other postretirement
plans were as follows:
For the year ended December 31,
2009 2008 2007
Discount rate 6.25% 6.25% 5.75%
Expected long-term rate of return on plan assets 7.30% 7.30% 8.00%
Rate of increase in compensation levels 4.25% 4.25% 4.25%
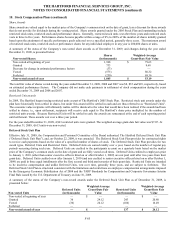
Assumed health care cost trend rates were as follows:
As of December 31,
2009 2008 2007
Pre-65 Health care cost trend rate 9.05% 8.80% 9.30%
Post-65 Health care cost trend rate 7.60% 7.00% 7.70%
Rate to which the cost trend rate is assumed to decline (the ultimate trend rate) 5.00% 5.00% 5.00%
Year that the rate reaches the ultimate trend rate 2018 2015 2013
Assumed health care cost trends have an effect on the amounts reported for the postretirement health care and life insurance benefit
plans. Increasing/decreasing the health care trend rates by one percent each year would have the effect of decreasing/increasing the
benefit obligation as of December 31, 2009 by $5 and the annual net periodic expense for the year then ended by $1.
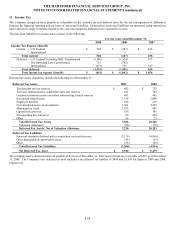
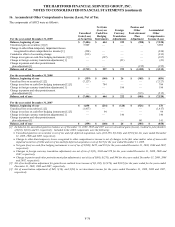
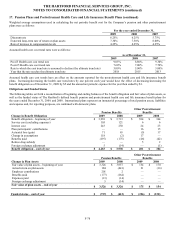
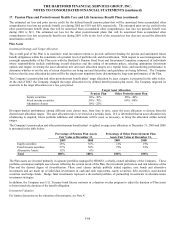
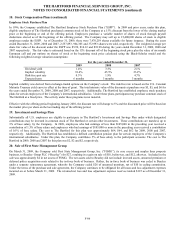
Obligations and Funded Status
The following tables set forth a reconciliation of beginning and ending balances of the benefit obligation and fair value of plan assets, as
well as the funded status of The Hartford’ s defined benefit pension and postretirement health care and life insurance benefit plans for
the years ended December 31, 2009, and 2008. International plans represent an immaterial percentage of total pension assets, liabilities
and expense and, for reporting purposes, are combined with domestic plans.
Pension Benefits
Other Postretirement
Benefits
Change in Benefit Obligation 2009 2008 2009 2008
Benefit obligation – beginning of year $3,938 $ 3,713 $ 384 $ 364
Service cost (excluding expenses) 105 121 6 6
Interest cost 243 230 24 23
Plan participants’ contributions — — 16 15
Actuarial loss (gain) 71 65 (5) 17
Change in assumptions 118 (2) 17 —
Benefits paid (197) (175) (46) (42)
Retiree drug subsidy — — 5 2
Foreign exchange adjustment 5 (14) — (1)
Benefit obligation – end of year $4,283 $ 3,938 $ 401 $ 384
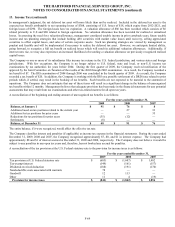
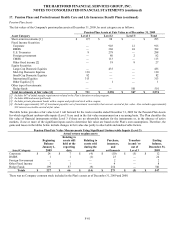
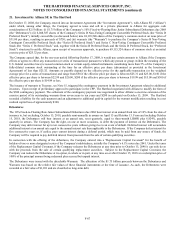
Pension Benefits
Other Postretirement
Benefits
Change in Plan Assets 2009 2008 2009 2008
Fair value of plan assets – beginning of year $ 3,326 $ 3,957 $ 154 $ 170
Actual return on plan assets 184 (441) 21 (16)
Employer contributions 201 2 — —
Benefits paid (177) (164) — —
Expenses paid (13) (14) — —
Foreign exchange adjustment 5 (14) — —
Fair value of plan assets – end of year $ 3,526 $ 3,326 $ 175 $ 154
Funded status – end of year $(757) $ (612) $ (226) $ (230)