The Hartford 2009 Annual Report Download - page 193
Download and view the complete annual report
Please find page 193 of the 2009 The Hartford annual report below. You can navigate through the pages in the report by either clicking on the pages listed below, or by using the keyword search tool below to find specific information within the annual report.-
 1
1 -
2
-
3
-
4
-
5
-
6
-
7
-
8
-
9
-
10
-
11
-
12
-
13
-
14
-
15
-
16
-
17
-
18
-
19
-
20
-
21
-
22
-
23
-
24
-
25
-
26
-
27
-
28
-
29
-
30
-
31
-
32
-
33
-
34
-
35
-
36
-
37
-
38
-
39
-
40
-
41
-
42
-
43
-
44
-
45
-
46
-
47
-
48
-
49
-
50
-
51
-
52
-
53
-
54
-
55
-
56
-
57
-
58
-
59
-
60
-
61
-
62
-
63
-
64
-
65
-
66
-
67
-
68
-
69
-
70
-
71
-
72
-
73
-
74
-
75
-
76
-
77
-
78
-
79
-
80
-
81
-
82
-
83
-
84
-
85
-
86
-
87
-
88
-
89
-
90
-
91
-
92
-
93
-
94
-
95
-
96
-
97
-
98
-
99
-
100
-
101
-
102
-
103
-
104
-
105
-
106
-
107
-
108
-
109
-
110
-
111
-
112
-
113
-
114
-
115
-
116
-
117
-
118
-
119
-
120
-
121
-
122
-
123
-
124
-
125
-
126
-
127
-
128
-
129
-
130
-
131
-
132
-
133
-
134
-
135
-
136
-
137
-
138
-
139
-
140
-
141
-
142
-
143
-
144
-
145
-
146
-
147
-
148
-
149
-
150
-
151
-
152
-
153
-
154
-
155
-
156
-
157
-
158
-
159
-
160
-
161
-
162
-
163
-
164
-
165
-
166
-
167
-
168
-
169
-
170
-
171
-
172
-
173
-
174
-
175
-
176
-
177
-
178
-
179
-
180
-
181
-
182
-
 183
183 -
 184
184 -
 185
185 -
 186
186 -
 187
187 -
 188
188 -
 189
189 -
 190
190 -
 191
191 -
 192
192 -
 193
193 -
 194
194 -
 195
195 -
 196
196 -
 197
197 -
 198
198 -
 199
199 -
 200
200 -
 201
201 -
 202
202 -
 203
203 -
204
-
205
-
206
-
207
-
208
-
209
-
210
-
211
-
212
-
213
-
214
-
215
-
216
-
217
-
218
-
219
-
220
-
221
-
222
-
223
-
224
-
225
-
226
-
227
-
228
-
229
-
230
-
231
-
232
-
233
-
234
-
235
-
236
-
237
-
238
-
239
-
240
-
241
-
242
-
243
-
244
-
245
-
246
-
247
-
248
-
249
-
250
-
251
-
252
-
253
-
254
-
255
-
256
-
257
-
258
-
259
-
260
-
261
-
262
-
263
-
264
-
265
-
266
-
267
 |
 |

THE HARTFORD FINANCIAL SERVICES GROUP, INC.
NOTES TO CONSOLIDATED FINANCIAL STATEMENTS (continued)
F-44
5. Investments and Derivative Instruments (continued)
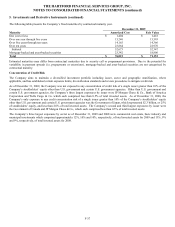
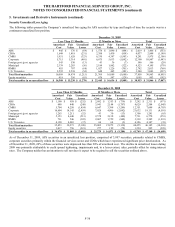
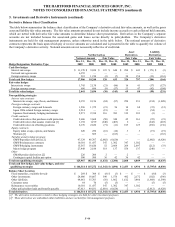
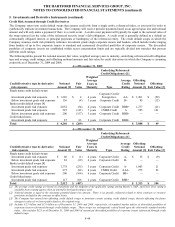
Derivative Balance Sheet Classification
The table below summarizes the balance sheet classification of the Company’ s derivative related fair value amounts, as well as the gross
asset and liability fair value amounts. The fair value amounts presented do not include income accruals or cash collateral held amounts,
which are netted with derivative fair value amounts to determine balance sheet presentation. Derivatives in the Company’ s separate
accounts are not included because the associated gains and losses accrue directly to policyholders. The Company’ s derivative
instruments are held for risk management purposes, unless otherwise noted in the table below. The notional amount of derivative
contracts represents the basis upon which pay or receive amounts are calculated and is presented in the table to quantify the volume of
the Company’ s derivative activity. Notional amounts are not necessarily reflective of credit risk.
Asset Liability
Net Derivatives Derivatives Derivatives
Notional Amount Fair Value Fair Value Fair Value
Hedge Designation/ Derivative Type
Dec. 31,
2009
Dec. 31,
2008
Dec. 31,
2009
Dec. 31,
2008
Dec. 31,
2009
Dec. 31,
2008
Dec. 31,
2009
Dec. 31,
2008
Cash flow hedges
Interest rate swaps $ 11,170 $ 9,030 $ 123 $ 640 $ 294 $ 643 $ (171) $ (3)
Forward rate agreements 6,355 — — — — — — —
Foreign currency swaps 381 1,210 (3) (7) 30 154 (33) (161)
Total cash flow hedges 17,906 10,240 120 633 324 797 (204) (164)
Fair value hedges
Interest rate swaps 1,745 2,138 (21) (86) 16 41 (37) (127)
Foreign currency swaps 696 696 (9) (57) 53 47 (62) (104)
Total fair value hedges 2,441 2,834 (30) (143) 69 88 (99) (231)
Non-qualifying strategies
Interest rate contracts
Interest rate swaps, caps, floors, and futures 8,355 8,156 (84) (97) 250 931 (334) (1,028)
Foreign exchange contracts
Foreign currency swaps and forwards 1,296 1,372 (21) 56 14 68 (35) (12)
Japan 3Win related foreign currency swaps 2,514 — (19) — 35 — (54) —
Japanese fixed annuity hedging instruments 2,271 2,334 316 383 319 383 (3) —
Credit contracts
Credit derivatives that purchase credit protection 2,606 3,668 (50) 340 45 361 (95) (21)
Credit derivatives that assume credit risk [1] 1,158 1,199 (240) (403) 2 — (242) (403)
Credit derivatives in offsetting positions 6,176 2,626 (71) (11) 185 125 (256) (136)
Equity contracts
Equity index swaps, options, and futures 220 256 (16) (16) 3 3 (19) (19)
Warrants [1] — 869 — (163) — — — (163)
Variable annuity hedge program
GMWB product derivatives [2] 47,329 48,767 (2,002) (6,620) — — (2,002) (6,620)
GMWB reinsurance contracts 10,301 11,437 347 1,302 347 1,302 — —
GMWB hedging instruments 15,567 18,620 52 2,664 264 2,697 (212) (33)
Macro hedge program 27,448 2,188 318 137 558 137 (240) —
Other
GMAB product derivatives [2] 226 206 2 — 2 — — —
Contingent capital facility put option 500 500 36 42 36 42 — —
Total non-qualifying strategies 125,967 102,198 (1,432) (2,386) 2,060 6,049 (3,492) (8,435)
Total cash flow hedges, fair value hedges, and non-
qualifying strategies $ 146,314 $ 115,272 $ (1,342) $ (1,896) $ 2,453 $ 6,934 $ (3,795) $ (8,830)
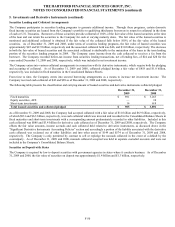
Balance Sheet Location
Fixed maturities, available-for-sale $ 269 $ 304 $ (8) $ (3) $ — $ — $ (8) $ (3)
Other investments 24,006 18,667 390 1,576 492 2,172 (102) (596)
Other liabilities 64,061 35,763 (56) 1,862 1,612 3,460 (1,668) (1,598)
Consumer notes 64 70 (5) (5) — — (5) (5)
Reinsurance recoverables 10,301 11,437 347 1,302 347 1,302 — —
Other policyholder funds and benefits payable 47,613 49,031 (2,010) (6,628) 2 — (2,012) (6,628)
Total derivatives $ 146,314 $ 115,272 $ (1,342) $ (1,896) $ 2,453 $ 6,934 $ (3,795) $ (8,830)
[1] The derivative instruments related to these hedging strategies are held for other investment purposes.
[2] These derivatives are embedded within liabilities and are not held for risk management purposes.