The Hartford 2009 Annual Report Download - page 140
Download and view the complete annual report
Please find page 140 of the 2009 The Hartford annual report below. You can navigate through the pages in the report by either clicking on the pages listed below, or by using the keyword search tool below to find specific information within the annual report.-
 1
1 -
2
-
3
-
4
-
5
-
6
-
7
-
8
-
9
-
10
-
11
-
12
-
13
-
14
-
15
-
16
-
17
-
18
-
19
-
20
-
21
-
22
-
23
-
24
-
25
-
26
-
27
-
28
-
29
-
30
-
31
-
32
-
33
-
34
-
35
-
36
-
37
-
38
-
39
-
40
-
41
-
42
-
43
-
44
-
45
-
46
-
47
-
48
-
49
-
50
-
51
-
52
-
53
-
54
-
55
-
56
-
57
-
58
-
59
-
60
-
61
-
62
-
63
-
64
-
65
-
66
-
67
-
68
-
69
-
70
-
71
-
72
-
73
-
74
-
75
-
76
-
77
-
78
-
79
-
80
-
81
-
82
-
83
-
84
-
85
-
86
-
87
-
88
-
89
-
90
-
91
-
92
-
93
-
94
-
95
-
96
-
97
-
98
-
99
-
100
-
101
-
102
-
103
-
104
-
105
-
106
-
107
-
108
-
109
-
110
-
111
-
112
-
113
-
114
-
115
-
116
-
117
-
118
-
119
-
120
-
121
-
122
-
123
-
124
-
125
-
126
-
127
-
128
-
129
-
 130
130 -
 131
131 -
 132
132 -
 133
133 -
 134
134 -
 135
135 -
 136
136 -
 137
137 -
 138
138 -
 139
139 -
 140
140 -
 141
141 -
 142
142 -
 143
143 -
 144
144 -
 145
145 -
 146
146 -
 147
147 -
 148
148 -
 149
149 -
 150
150 -
151
-
152
-
153
-
154
-
155
-
156
-
157
-
158
-
159
-
160
-
161
-
162
-
163
-
164
-
165
-
166
-
167
-
168
-
169
-
170
-
171
-
172
-
173
-
174
-
175
-
176
-
177
-
178
-
179
-
180
-
181
-
182
-
183
-
184
-
185
-
186
-
187
-
188
-
189
-
190
-
191
-
192
-
193
-
194
-
195
-
196
-
197
-
198
-
199
-
200
-
201
-
202
-
203
-
204
-
205
-
206
-
207
-
208
-
209
-
210
-
211
-
212
-
213
-
214
-
215
-
216
-
217
-
218
-
219
-
220
-
221
-
222
-
223
-
224
-
225
-
226
-
227
-
228
-
229
-
230
-
231
-
232
-
233
-
234
-
235
-
236
-
237
-
238
-
239
-
240
-
241
-
242
-
243
-
244
-
245
-
246
-
247
-
248
-
249
-
250
-
251
-
252
-
253
-
254
-
255
-
256
-
257
-
258
-
259
-
260
-
261
-
262
-
263
-
264
-
265
-
266
-
267
 |
 |
140
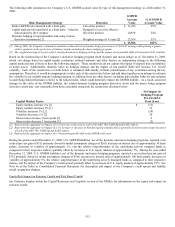
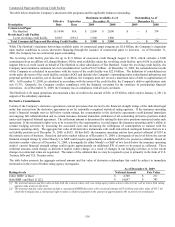
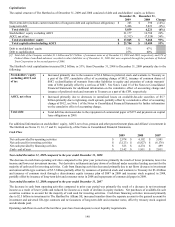
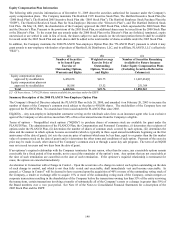
Capitalization
The capital structure of The Hartford as of December 31, 2009 and 2008 consisted of debt and stockholders’ equity, as follows:
December 31,
2009
December 31,
2008
Change
Short-term debt (includes current maturities of long-term debt and capital lease obligations) $ 343 $ 398 (14%)
Long-term debt 5,496 5,823 (6%)
Total debt [1] 5,839 6,221 (6%)
Stockholders’ equity excluding AOCI 21,177 16,788 26%
AOCI, net of tax (3,312) (7,520) 56%
Total stockholders' equity $17,865 $ 9,268 93%
Total capitalization including AOCI $23,704 $ 15,489 53%
Debt to stockholders’ equity 33% 67%
Debt to capitalization 25% 40%
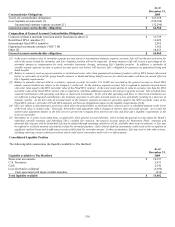
[1] Total debt of the Company excludes $1.1 billion and $1.2 billion of consumer notes as of December 31, 2009 and 2008, respectively, and $78 of
Federal Home Loan Bank advances recorded in other liabilities as of December 31, 2009 that were acquired through the purchase of Federal
Trust Corporation in the second quarter of 2009.
The Hartford’ s total capitalization increased $8.2 billion, or 53%, from December 31, 2008 to December 31, 2009 primarily due to the
following:
Stockholders’ equity
excluding AOCI, net
of tax
• Increased primarily due to the issuance of $3.4 billion in preferred stock and warrants to Treasury as
a part of the CPP, cumulative effect of accounting change of $912, issuance of common shares of
$887, reclassification of warrants from other liabilities to equity and extension of certain warrants’
term of $186 partially offset by a net loss of $887. See Notes 1 and 15 of the Notes to Consolidated
Financial Statements for additional information on the cumulative effect of accounting change and
issuance of preferred stock and warrants to Treasury as a part of the CPP, respectively.
AOCI, net of tax • Increased primarily due to decreases in unrealized losses on available-for-sale securities of $5.7
billion primarily due to tightening credit spreads, partially offset by a cumulative effect of accounting
change of $912, see Note 1 of the Notes to Consolidated Financial Statements for further information
on the cumulative effect of accounting change.
Total debt • Total debt has decreased due to the repayment of commercial paper of $375 and payments on capital
lease obligations in 2009.
For additional information on stockholders’ equity, AOCI, net of tax, pension and other postretirement plans and Allianz’ s investment in
The Hartford see Notes 15, 16, 17 and 21, respectively, of the Notes to Consolidated Financial Statements.
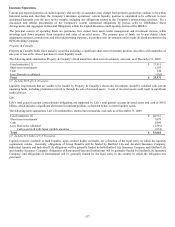
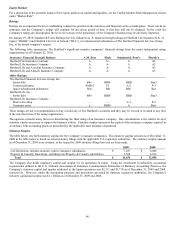
Cash Flow
2009 2008 2007
Net cash provided by operating activities $2,974 $ 4,192 $5,991
Net cash used for investing activities $(3,123) $ (8,827) $(6,176)
Net cash provided by financing activities $523 $ 4,274 $499
Cash - end of year $2,142 $ 1,811 $2,011
Year ended December 31, 2009 compared to the year ended December 31, 2008
The decrease in cash from operating activities compared to the prior year period was primarily the result of lower premiums, lower fee
income and lower net investment income. Net derivative settlements and pay down of collateral under securities lending account for the
majority of cash used for investing activities. Cash from financing activities decreased primarily due to net flows decrease in investment
and universal life-type contracts of $5.5 billion partially offset by issuances of preferred stock and warrants to Treasury for $3.4 billion
and issuance of common stock through a discretionary equity issuance plan of $887 in 2009 and treasury stock acquired in 2008,
partially offset by issuance of long-term debt and consumer notes in 2008 and repayments of commercial paper in 2009.
Year ended December 31, 2008 compared to the year ended December 31, 2007
The decrease in cash from operating activities compared to prior year period was primarily the result of a decrease in net investment
income as a result of lower yields and reduced fee income as a result of declines in equity markets. Net purchases of available-for-sale
securities continue to account for the majority of cash used for investing activities. Cash from financing activities increased primarily
due to $2.5 billion in investment in The Hartford by Allianz SE, increased transfers from the separate account to the general account for
investment and universal life-type contracts and net issuances of long-term debt and consumer notes, offset by treasury stock acquired
and dividends paid.
Operating cash flows in each of the last three years have been adequate to meet liquidity requirements.