The Hartford 2009 Annual Report Download - page 203
Download and view the complete annual report
Please find page 203 of the 2009 The Hartford annual report below. You can navigate through the pages in the report by either clicking on the pages listed below, or by using the keyword search tool below to find specific information within the annual report.-
 1
1 -
2
-
3
-
4
-
5
-
6
-
7
-
8
-
9
-
10
-
11
-
12
-
13
-
14
-
15
-
16
-
17
-
18
-
19
-
20
-
21
-
22
-
23
-
24
-
25
-
26
-
27
-
28
-
29
-
30
-
31
-
32
-
33
-
34
-
35
-
36
-
37
-
38
-
39
-
40
-
41
-
42
-
43
-
44
-
45
-
46
-
47
-
48
-
49
-
50
-
51
-
52
-
53
-
54
-
55
-
56
-
57
-
58
-
59
-
60
-
61
-
62
-
63
-
64
-
65
-
66
-
67
-
68
-
69
-
70
-
71
-
72
-
73
-
74
-
75
-
76
-
77
-
78
-
79
-
80
-
81
-
82
-
83
-
84
-
85
-
86
-
87
-
88
-
89
-
90
-
91
-
92
-
93
-
94
-
95
-
96
-
97
-
98
-
99
-
100
-
101
-
102
-
103
-
104
-
105
-
106
-
107
-
108
-
109
-
110
-
111
-
112
-
113
-
114
-
115
-
116
-
117
-
118
-
119
-
120
-
121
-
122
-
123
-
124
-
125
-
126
-
127
-
128
-
129
-
130
-
131
-
132
-
133
-
134
-
135
-
136
-
137
-
138
-
139
-
140
-
141
-
142
-
143
-
144
-
145
-
146
-
147
-
148
-
149
-
150
-
151
-
152
-
153
-
154
-
155
-
156
-
157
-
158
-
159
-
160
-
161
-
162
-
163
-
164
-
165
-
166
-
167
-
168
-
169
-
170
-
171
-
172
-
173
-
174
-
175
-
176
-
177
-
178
-
179
-
180
-
181
-
182
-
183
-
184
-
185
-
186
-
187
-
188
-
189
-
190
-
191
-
192
-
 193
193 -
 194
194 -
 195
195 -
 196
196 -
 197
197 -
 198
198 -
 199
199 -
 200
200 -
 201
201 -
 202
202 -
 203
203 -
 204
204 -
 205
205 -
 206
206 -
 207
207 -
 208
208 -
 209
209 -
 210
210 -
 211
211 -
 212
212 -
 213
213 -
214
-
215
-
216
-
217
-
218
-
219
-
220
-
221
-
222
-
223
-
224
-
225
-
226
-
227
-
228
-
229
-
230
-
231
-
232
-
233
-
234
-
235
-
236
-
237
-
238
-
239
-
240
-
241
-
242
-
243
-
244
-
245
-
246
-
247
-
248
-
249
-
250
-
251
-
252
-
253
-
254
-
255
-
256
-
257
-
258
-
259
-
260
-
261
-
262
-
263
-
264
-
265
-
266
-
267
 |
 |

THE HARTFORD FINANCIAL SERVICES GROUP, INC.
NOTES TO CONSOLIDATED FINANCIAL STATEMENTS (continued)
F-54
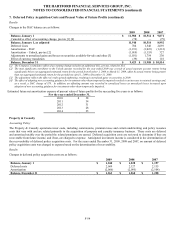
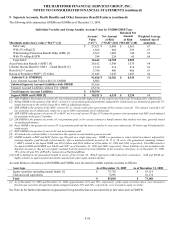
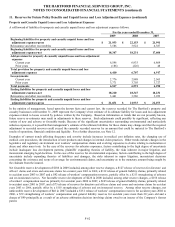
7. Deferred Policy Acquisition Costs and Present Value of Future Profits (continued)
Results
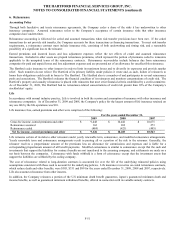
Changes in the DAC balance are as follows:
2009 2008 2007
Balance, January 1 $ 11,988 $ 10,514 $ 9,071
Cumulative effect of accounting change, pre-tax [1] [4] (78) — (79)
Balance, January 1, as adjusted 11,910 10,514 8,992
Deferred Costs 784 1,548 2,059
Amortization – DAC (1,191) (1,023) (1,212)
Amortization – Unlock, pre-tax [2] (1,010) (1,153) 327
Adjustments to unrealized gains and losses on securities available-for-sale and other [3] (1,031) 1,754 230
Effect of currency translation (39) 348 118
Balance, December 31 $ 9,423 $ 11,988 $ 10,514
[1] The Company’s cumulative effect of accounting change includes an additional $(1), pre-tax, related to SIA.
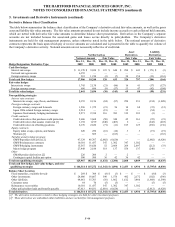
[2] The most significant contributor to the Unlock amount recorded for the year ended 2009 was a result of actual separate account returns being
significantly below our aggregated estimated return for the period from October 1, 2008 to March 31, 2009, offset by actual returns being greater
than our aggregated estimated return for the period from April 1, 2009 to December 31, 2009.
[3] The adjustment reflects the effect of credit spreads tightening, resulting in unrealized gains on securities in 2009.
[4] The effect of adopting new accounting guidance for investments other than temporarily impaired resulted in an increase to retained earnings and,
as a result, a DAC charge of $78. In addition, an offsetting amount was recorded in unrealized losses as unrealized losses increased upon
adoption of new accounting guidance for investments other-than-temporarily impaired.
Estimated future net amortization expense of present value of future profits for the succeeding five years is as follows:
For the years ended December 31,
2010 $ 38
2011 34
2012 31
2013 28
2014 25
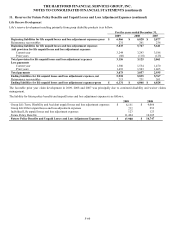
Property & Casualty
Accounting Policy
The Property & Casualty operations incur costs, including commissions, premium taxes and certain underwriting and policy issuance
costs that vary with and are related primarily to the acquisition of property and casualty insurance business. These costs are deferred
and amortized ratably over the period the related premiums are earned. Deferred acquisition costs are reviewed to determine if they are
recoverable from future income, and if not, are charged to expense. Anticipated investment income is considered in the determination of
the recoverability of deferred policy acquisition costs. For the years ended December 31, 2009, 2008 and 2007, no amount of deferred
policy acquisition costs was charged to expense based on the determination of recoverability.
Results
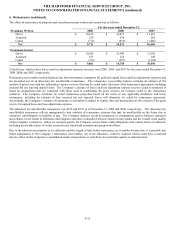
Changes in deferred policy acquisition costs are as follows:
2009 2008 2007
Balance, January 1 $ 1,260 $ 1,228 $ 1,197
Deferred costs 2,069 2,127 2,135
Amortization (2,066) (2,095) (2,104)
Balance, December 31 $ 1,263 $ 1,260 $ 1,228