The Hartford 2009 Annual Report Download - page 172
Download and view the complete annual report
Please find page 172 of the 2009 The Hartford annual report below. You can navigate through the pages in the report by either clicking on the pages listed below, or by using the keyword search tool below to find specific information within the annual report.-
 1
1 -
2
-
3
-
4
-
5
-
6
-
7
-
8
-
9
-
10
-
11
-
12
-
13
-
14
-
15
-
16
-
17
-
18
-
19
-
20
-
21
-
22
-
23
-
24
-
25
-
26
-
27
-
28
-
29
-
30
-
31
-
32
-
33
-
34
-
35
-
36
-
37
-
38
-
39
-
40
-
41
-
42
-
43
-
44
-
45
-
46
-
47
-
48
-
49
-
50
-
51
-
52
-
53
-
54
-
55
-
56
-
57
-
58
-
59
-
60
-
61
-
62
-
63
-
64
-
65
-
66
-
67
-
68
-
69
-
70
-
71
-
72
-
73
-
74
-
75
-
76
-
77
-
78
-
79
-
80
-
81
-
82
-
83
-
84
-
85
-
86
-
87
-
88
-
89
-
90
-
91
-
92
-
93
-
94
-
95
-
96
-
97
-
98
-
99
-
100
-
101
-
102
-
103
-
104
-
105
-
106
-
107
-
108
-
109
-
110
-
111
-
112
-
113
-
114
-
115
-
116
-
117
-
118
-
119
-
120
-
121
-
122
-
123
-
124
-
125
-
126
-
127
-
128
-
129
-
130
-
131
-
132
-
133
-
134
-
135
-
136
-
137
-
138
-
139
-
140
-
141
-
142
-
143
-
144
-
145
-
146
-
147
-
148
-
149
-
150
-
151
-
152
-
153
-
154
-
155
-
156
-
157
-
158
-
159
-
160
-
161
-
 162
162 -
 163
163 -
 164
164 -
 165
165 -
 166
166 -
 167
167 -
 168
168 -
 169
169 -
 170
170 -
 171
171 -
 172
172 -
 173
173 -
 174
174 -
 175
175 -
 176
176 -
 177
177 -
 178
178 -
 179
179 -
 180
180 -
 181
181 -
 182
182 -
183
-
184
-
185
-
186
-
187
-
188
-
189
-
190
-
191
-
192
-
193
-
194
-
195
-
196
-
197
-
198
-
199
-
200
-
201
-
202
-
203
-
204
-
205
-
206
-
207
-
208
-
209
-
210
-
211
-
212
-
213
-
214
-
215
-
216
-
217
-
218
-
219
-
220
-
221
-
222
-
223
-
224
-
225
-
226
-
227
-
228
-
229
-
230
-
231
-
232
-
233
-
234
-
235
-
236
-
237
-
238
-
239
-
240
-
241
-
242
-
243
-
244
-
245
-
246
-
247
-
248
-
249
-
250
-
251
-
252
-
253
-
254
-
255
-
256
-
257
-
258
-
259
-
260
-
261
-
262
-
263
-
264
-
265
-
266
-
267
 |
 |
THE HARTFORD FINANCIAL SERVICES GROUP, INC.
NOTES TO CONSOLIDATED FINANCIAL STATEMENTS (continued)
F-23
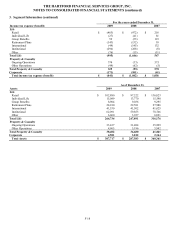
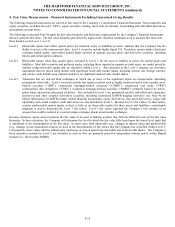
4. Fair Value Measurements – Financial Instruments Excluding Guaranteed Living Benefits (continued)
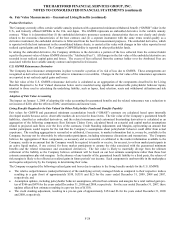
Derivative Instruments, including embedded derivatives within investments
Freestanding derivative instruments are reported in the Consolidated Balance Sheets at fair value and are reported in other investments
and other liabilities. Embedded derivatives are reported with the host instruments in the Consolidated Balance Sheet. Derivative
instruments are fair valued using pricing valuation models, which utilize market data inputs or independent broker quotations.
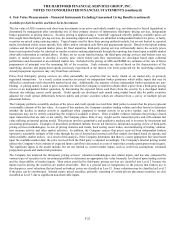
Excluding embedded and reinsurance related derivatives, as of December 31, 2009 and 2008, 97% and 94%, respectively, of derivatives,
based upon notional values, were priced by valuation models, which utilize independent market data. The remaining derivatives were
priced by broker quotations. The derivatives are valued using mid-market inputs that are predominantly observable in the market.
Inputs used to value derivatives include, but are not limited to, interest swap rates, foreign currency forward and spot rates, credit
spreads and correlations, interest and equity volatility and equity index levels. The Company performs a monthly analysis on derivative
valuations which includes both quantitative and qualitative analysis. Examples of procedures performed include, but are not limited to,
review of pricing statistics and trends, back testing recent trades, analyzing the impacts of changes in the market environment, and
review of changes in market value for each derivative including those derivatives priced by brokers.
The Company utilizes derivative instruments to manage the risk associated with certain assets and liabilities. However, the derivative
instrument may not be classified with the same fair value hierarchy level as the associated assets and liabilities. Therefore the realized
and unrealized gains and losses on derivatives reported in Level 3 may not reflect the offsetting impact of the realized and unrealized
gains and losses of the associated assets and liabilities.
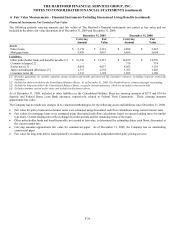
Separate Account Assets
Separate account assets are primarily invested in mutual funds but also have investments in fixed maturity and equity securities. The
separate account investments are valued in the same manner, and using the same pricing sources and inputs, as the fixed maturity, equity
security, and short-term investments of the Company.
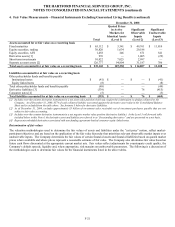
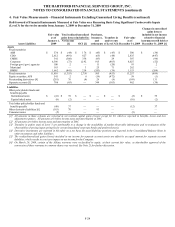
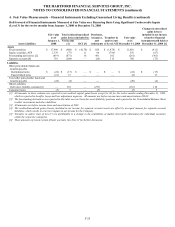
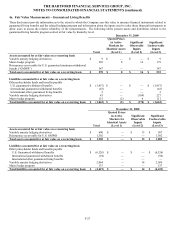
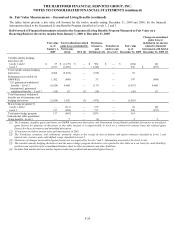
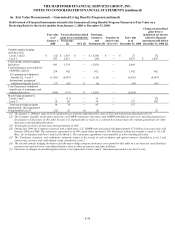
Assets and Liabilities Measured at Fair Value on a Recurring Basis Using Significant Unobservable Inputs (Level 3)
The tables below provide a fair value roll forward for the twelve months ending December 31, 2009 and 2008, for the financial
instruments classified as Level 3, excluding those related to the Company’ s living benefits and associated hedging programs, which are
reported in Note 4a.