The Hartford 2009 Annual Report Download - page 196
Download and view the complete annual report
Please find page 196 of the 2009 The Hartford annual report below. You can navigate through the pages in the report by either clicking on the pages listed below, or by using the keyword search tool below to find specific information within the annual report.-
 1
1 -
2
-
3
-
4
-
5
-
6
-
7
-
8
-
9
-
10
-
11
-
12
-
13
-
14
-
15
-
16
-
17
-
18
-
19
-
20
-
21
-
22
-
23
-
24
-
25
-
26
-
27
-
28
-
29
-
30
-
31
-
32
-
33
-
34
-
35
-
36
-
37
-
38
-
39
-
40
-
41
-
42
-
43
-
44
-
45
-
46
-
47
-
48
-
49
-
50
-
51
-
52
-
53
-
54
-
55
-
56
-
57
-
58
-
59
-
60
-
61
-
62
-
63
-
64
-
65
-
66
-
67
-
68
-
69
-
70
-
71
-
72
-
73
-
74
-
75
-
76
-
77
-
78
-
79
-
80
-
81
-
82
-
83
-
84
-
85
-
86
-
87
-
88
-
89
-
90
-
91
-
92
-
93
-
94
-
95
-
96
-
97
-
98
-
99
-
100
-
101
-
102
-
103
-
104
-
105
-
106
-
107
-
108
-
109
-
110
-
111
-
112
-
113
-
114
-
115
-
116
-
117
-
118
-
119
-
120
-
121
-
122
-
123
-
124
-
125
-
126
-
127
-
128
-
129
-
130
-
131
-
132
-
133
-
134
-
135
-
136
-
137
-
138
-
139
-
140
-
141
-
142
-
143
-
144
-
145
-
146
-
147
-
148
-
149
-
150
-
151
-
152
-
153
-
154
-
155
-
156
-
157
-
158
-
159
-
160
-
161
-
162
-
163
-
164
-
165
-
166
-
167
-
168
-
169
-
170
-
171
-
172
-
173
-
174
-
175
-
176
-
177
-
178
-
179
-
180
-
181
-
182
-
183
-
184
-
185
-
 186
186 -
 187
187 -
 188
188 -
 189
189 -
 190
190 -
 191
191 -
 192
192 -
 193
193 -
 194
194 -
 195
195 -
 196
196 -
 197
197 -
 198
198 -
 199
199 -
 200
200 -
 201
201 -
 202
202 -
 203
203 -
 204
204 -
 205
205 -
 206
206 -
207
-
208
-
209
-
210
-
211
-
212
-
213
-
214
-
215
-
216
-
217
-
218
-
219
-
220
-
221
-
222
-
223
-
224
-
225
-
226
-
227
-
228
-
229
-
230
-
231
-
232
-
233
-
234
-
235
-
236
-
237
-
238
-
239
-
240
-
241
-
242
-
243
-
244
-
245
-
246
-
247
-
248
-
249
-
250
-
251
-
252
-
253
-
254
-
255
-
256
-
257
-
258
-
259
-
260
-
261
-
262
-
263
-
264
-
265
-
266
-
267
 |
 |

THE HARTFORD FINANCIAL SERVICES GROUP, INC.
NOTES TO CONSOLIDATED FINANCIAL STATEMENTS (continued)
F-47
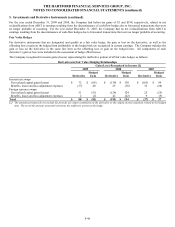
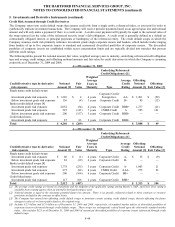
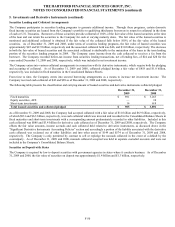
5. Investments and Derivative Instruments (continued)
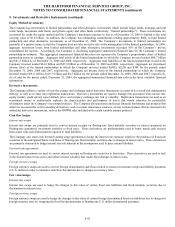
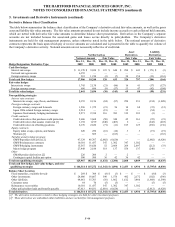
Non-qualifying Strategies
For non-qualifying strategies, including embedded derivatives that are required to be bifurcated from their host contracts and accounted
for as derivatives, the gain or loss on the derivative is recognized currently in earnings within net realized capital gains or losses. The
following table presents the gain or loss recognized in income on non-qualifying strategies:
Non-qualifying Strategies
Gain (Loss) Recognized within Net Realized Capital Gains (Losses)
December 31,
2009 2008 2007
Interest rate contracts
Interest rate swaps, caps, floors, and forwards $ 31 $ 12 $ 29
Foreign exchange contracts
Foreign currency swaps and forwards (66) 87 (24)
Japan 3Win related foreign currency swaps [1] (22) — —
Japanese fixed annuity hedging instruments [2] (12) 487 53
Credit contracts
Credit derivatives that purchase credit protection (533) 302 84
Credit derivatives that assume credit risk 167 (623) (332)
Equity contracts
Equity index swaps, options, and futures (3) (25) 2
Warrants 70 110 —
Variable annuity hedge program
GMWB product derivatives 4,748 (5,786) (670)
GMWB reinsurance contracts (988) 1,073 127
GMWB hedging instruments (2,234) 3,374 257
Macro hedge program (895) 74 (12)
Other
GMAB product derivatives 5 2 2
Contingent capital facility put option (8) (3) (4)
Total $ 260 $ (916) $ (488)
[1] The associated liability is adjusted for changes in dollar/yen exchange spot rates through realized capital gains and losses and was $64 for the
year ended December 31, 2009. There was no Japan 3Win related foreign currency swaps for the years ended December 31, 2008 and 2007.
[2] The associated liability is adjusted for changes in dollar/yen exchange spot rates through realized capital gains and losses and was $67, $450,
and $(102) for the years ended December 31, 2009, 2008 and 2007, respectively.
For the year ended December 31, 2009, the net realized capital gain (loss) related to derivatives used in non-qualifying strategies was
primarily due to the following:
• The net gain on GMWB related derivatives for the year ended December 31, 2009, was primarily due to liability model assumption
updates given favorable trends in policyholder experience, the relative outperformance of the underlying actively managed funds as
compared to their respective indices, and the impact of the Company’ s own credit standing. Additional net gains on GMWB
related derivatives include lower implied market volatility and a general increase in long-term interest rates, partially offset by
rising equity markets. For more information on the policyholder behavior and liability model assumption updates, see Note 4a.
• The net loss on the macro hedge program was primarily the result of an increase in the equity markets and the impact of trading
activity.
• The net loss on credit derivatives that purchase credit protection to economically hedge fixed maturity securities and the net gain on
credit derivatives that assume credit risk as a part of replication transactions resulted from credit spreads tightening.