The Hartford 2009 Annual Report Download - page 119
Download and view the complete annual report
Please find page 119 of the 2009 The Hartford annual report below. You can navigate through the pages in the report by either clicking on the pages listed below, or by using the keyword search tool below to find specific information within the annual report.-
 1
1 -
2
-
3
-
4
-
5
-
6
-
7
-
8
-
9
-
10
-
11
-
12
-
13
-
14
-
15
-
16
-
17
-
18
-
19
-
20
-
21
-
22
-
23
-
24
-
25
-
26
-
27
-
28
-
29
-
30
-
31
-
32
-
33
-
34
-
35
-
36
-
37
-
38
-
39
-
40
-
41
-
42
-
43
-
44
-
45
-
46
-
47
-
48
-
49
-
50
-
51
-
52
-
53
-
54
-
55
-
56
-
57
-
58
-
59
-
60
-
61
-
62
-
63
-
64
-
65
-
66
-
67
-
68
-
69
-
70
-
71
-
72
-
73
-
74
-
75
-
76
-
77
-
78
-
79
-
80
-
81
-
82
-
83
-
84
-
85
-
86
-
87
-
88
-
89
-
90
-
91
-
92
-
93
-
94
-
95
-
96
-
97
-
98
-
99
-
100
-
101
-
102
-
103
-
104
-
105
-
106
-
107
-
108
-
 109
109 -
 110
110 -
 111
111 -
 112
112 -
 113
113 -
 114
114 -
 115
115 -
 116
116 -
 117
117 -
 118
118 -
 119
119 -
 120
120 -
 121
121 -
 122
122 -
 123
123 -
 124
124 -
 125
125 -
 126
126 -
 127
127 -
 128
128 -
 129
129 -
130
-
131
-
132
-
133
-
134
-
135
-
136
-
137
-
138
-
139
-
140
-
141
-
142
-
143
-
144
-
145
-
146
-
147
-
148
-
149
-
150
-
151
-
152
-
153
-
154
-
155
-
156
-
157
-
158
-
159
-
160
-
161
-
162
-
163
-
164
-
165
-
166
-
167
-
168
-
169
-
170
-
171
-
172
-
173
-
174
-
175
-
176
-
177
-
178
-
179
-
180
-
181
-
182
-
183
-
184
-
185
-
186
-
187
-
188
-
189
-
190
-
191
-
192
-
193
-
194
-
195
-
196
-
197
-
198
-
199
-
200
-
201
-
202
-
203
-
204
-
205
-
206
-
207
-
208
-
209
-
210
-
211
-
212
-
213
-
214
-
215
-
216
-
217
-
218
-
219
-
220
-
221
-
222
-
223
-
224
-
225
-
226
-
227
-
228
-
229
-
230
-
231
-
232
-
233
-
234
-
235
-
236
-
237
-
238
-
239
-
240
-
241
-
242
-
243
-
244
-
245
-
246
-
247
-
248
-
249
-
250
-
251
-
252
-
253
-
254
-
255
-
256
-
257
-
258
-
259
-
260
-
261
-
262
-
263
-
264
-
265
-
266
-
267
 |
 |

119
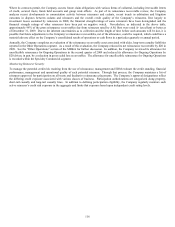
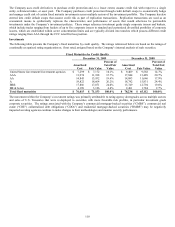
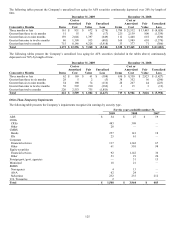
The following table presents the Company’ s AFS securities by type.
Available-for-Sale Securities by Type
December 31, 2009 December 31, 2008
Cost or
Amortized
Cost
Gross
Unrealized
Gains
Gross
Unrealized
Losses
Fair
Value
Percent
of Total
Fair
Value
Cost or
Amortized
Cost
Gross
Unrealized
Gains
Gross
Unrealized
Losses
Fair
Value
Percent
of Total
Fair
Value
Asset-backed securities
(“ABS”)
Consumer loans $ 2,087 $ 15 $ (277) $ 1,825 2.6% $ 2,251 $ –– $ (589) $ 1,662 2.6%
Small business 548 1 (232) 317 0.4% 570 –– (250) 320 0.5%
Other 405 20 (44) 381 0.5% 610 6 (132) 484 0.7%
CDOs
CLOs [1] 2,727 — (288) 2,439 3.5% 2,865 –– (735) 2,130 3.3%
CREs 1,319 21 (901) 439 0.6% 1,763 2 (1,302) 463 0.7%
Other 8 6 — 14 — 27 –– (8) 19 ––
CMBS
Agency backed [2] 62 3 — 65 0.1% 433 16 –– 449 0.7%
Bonds 9,600 52 (2,241) 7,411 10.4% 11,144 10 (4,370) 6,784 10.4%
Interest only (“IOs”) 1,074 59 (65) 1,068 1.5% 1,396 17 (333) 1,080 1.7%
Corporate
Basic industry 2,642 112 (56) 2,698 3.8% 2,138 33 (338) 1,833 2.8%
Capital goods 3,085 140 (51) 3,174 4.5% 2,480 32 (322) 2,190 3.3%
Consumer cyclical 1,946 75 (45) 1,976 2.8% 2,335 34 (388) 1,981 3.0%
Consumer non-cyclical 4,737 281 (22) 4,996 7.0% 3,435 60 (252) 3,243 5.0%
Energy 3,070 163 (18) 3,215 4.5% 1,669 24 (146) 1,547 2.4%
Financial services 8,059 118 (917) 7,260 10.1% 8,422 254 (1,543) 7,133 10.9%
Tech./comm. 3,984 205 (75) 4,114 5.8% 3,738 86 (400) 3,424 5.3%
Transportation 698 22 (23) 697 1.0% 508 8 (90) 426 0.7%
Utilities 5,755 230 (85) 5,900 8.3% 4,859 92 (578) 4,373 6.7%
Other [3] 1,342 22 (151) 1,213 1.7% 1,475 –– (444) 1,031 1.6%
Foreign govt./govt.
agencies 1,376 52 (20) 1,408 2.0% 2,786 100 (65) 2,821 4.3%
Municipal
Taxable 1,176 4 (205) 975 1.4% 1,115 8 (229) 894 1.4%
Tax-exempt 10,949 314 (173) 11,090 15.6% 10,291 194 (724) 9,761 15.0%
RMBS
Agency 3,383 99 (6) 3,476 4.9% 3,092 88 (15) 3,165 4.9%
Non-agency 143 — (16) 127 0.2% 213 –– (48) 165 0.2%
Alt-A 218 — (58) 160 0.2% 305 –– (108) 197 0.3%
Sub-prime 1,768 5 (689) 1,084 1.5% 2,435 8 (862) 1,581 2.4%
U.S. Treasuries 3,854 14 (237) 3,631 5.1% 5,883 112 (39) 5,956 9.2%
Total fixed maturities 76,015 2,033 (6,895) 71,153 100.0% 78,238 1,184 (14,310) 65,112 100.0%
Equity securities
Financial Services 836 7 (164) 679 973 13 (196) 790
Other 497 73 (28) 542 581 190 (103) 668
Total equity securities 1,333 80 (192) 1,221 1,554 203 (299) 1,458
Total AFS securities [4] $ 77,348 $ 2,113 $ (7,087) $ 72,374 $ 79,792 $ 1,387 $ (14,609) $ 66,570
[1] As of December 31, 2009, 79% of these senior secured bank loan collateralized loan obligations (“CLOs”) were rated AA and above with an
average subordination of 29%.
[2] Represents securities with pools of loans by the Small Business Administration whose issued loans are backed by the full faith and credit of the
U.S. government.
[3] Includes structured investments with an amortized cost and fair value of $533 and $433, respectively, as of December 31, 2009 and $526 and
$364, respectively, as of December 31, 2008. The underlying securities supporting these investments are primarily diversified pools of investment
grade corporate issuers which can withstand a 15% cumulative default rate, assuming a 35% recovery.
[4] Gross unrealized gains represent gains of $1,474, $633, and $6 for Life, Property & Casualty, and Corporate, respectively, as of December 31,
2009 and $860, $526, and $1, respectively, as of December 31, 2008. Gross unrealized losses represent losses of $5,592, $1,491, and $4 for Life,
Property & Casualty, and Corporate, respectively, as of December 31, 2009 and $10,766, $3,835, and $8, respectively, as of December 31, 2008.
The Company reallocated its AFS investment portfolio to securities with more favorable risk profiles, in particular investment grade
corporate securities, while reducing its exposure to real estate related securities. Additionally, the Company reduced its allocation to
U.S. Treasuries in order to manage liquidity. The Company’ s AFS net unrealized loss position decreased primarily as a result of
improved security valuations due to credit spread tightening, partially offset by rising interest rates and a $1.4 billion before-tax
cumulative effect of accounting change related to impairments. For further discussion on the accounting change, see Note 1 of the
Notes to Consolidated Financial Statements. The following sections highlight the Company’ s significant investment sectors.