Rogers 2013 Annual Report Download - page 91
Download and view the complete annual report
Please find page 91 of the 2013 Rogers annual report below. You can navigate through the pages in the report by either clicking on the pages listed below, or by using the keyword search tool below to find specific information within the annual report.-
 1
1 -
2
-
3
-
4
-
5
-
6
-
7
-
8
-
9
-
10
-
11
-
12
-
13
-
14
-
15
-
16
-
17
-
18
-
19
-
20
-
21
-
22
-
23
-
24
-
25
-
26
-
27
-
28
-
29
-
30
-
31
-
32
-
33
-
34
-
35
-
36
-
37
-
38
-
39
-
40
-
41
-
42
-
43
-
44
-
45
-
46
-
47
-
48
-
49
-
50
-
51
-
52
-
53
-
54
-
55
-
56
-
57
-
58
-
59
-
60
-
61
-
62
-
63
-
64
-
65
-
66
-
67
-
68
-
69
-
70
-
71
-
72
-
73
-
74
-
75
-
76
-
77
-
78
-
79
-
80
-
 81
81 -
 82
82 -
 83
83 -
 84
84 -
 85
85 -
 86
86 -
 87
87 -
 88
88 -
 89
89 -
 90
90 -
 91
91 -
 92
92 -
 93
93 -
 94
94 -
 95
95 -
 96
96 -
 97
97 -
 98
98 -
 99
99 -
 100
100 -
 101
101 -
102
-
103
-
104
-
105
-
106
-
107
-
108
-
109
-
110
-
111
-
112
-
113
-
114
-
115
-
116
-
117
-
118
-
119
-
120
-
121
-
122
-
123
-
124
-
125
-
126
-
127
-
128
-
129
-
130
-
131
-
132
 |
 |

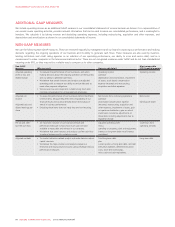
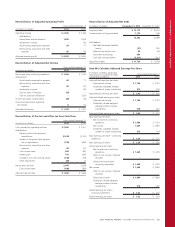
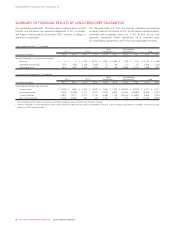
MANAGEMENT’S DISCUSSION AND ANALYSIS
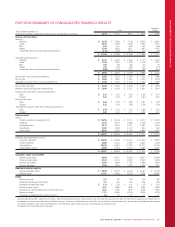
FIVE-YEAR SUMMARY OF CONSOLIDATED FINANCIAL RESULTS
Years Ended December 31
(In millions of dollars, except per share amounts, percentages and ratios)
IFRS
Canadian
GAAP
2013 2012 2011 2010 2009
Income and Cash Flow:
Revenue
Wireless $ 7,270 $ 7,280 $ 7,138 $ 6,973 $ 6,685
Cable 3,475 3,358 3,309 3,190 3,074
RBS 374 351 405 452 446
Media 1,704 1,620 1,611 1,461 1,407
Corporate items and intercompany eliminations (117) (123) (117) (77) (75)
$ 12,706 $ 12,486 $ 12,346 $ 11,999 $ 11,537
Adjusted operating profit 1
Wireless $ 3,157 $ 3,063 $ 3,036 $ 3,173 $ 3,067
Cable 1,718 1,605 1,549 1,419 1,300
RBS 106 89 86 40 35
Media 161 190 180 131 119
Corporate items and intercompany eliminations (149) (113) (112) (95) ` (114)
$ 4,993 $ 4,834 $ 4,739 $ 4,668 $ 4,407
Net income from continuing operations $ 1,669 $ 1,725 $ 1,590 $ 1,532 $ 1,499
Net income $ 1,669 $ 1,693 $ 1,563 $ 1,502 $ 1,478
Adjusted net income from continuing operations 1$ 1,769 $ 1,781 $ 1,736 $ 1,704 $ 1,569
Pre-tax free cash flow 1$ 2,044 $ 2,029 $ 1,973 $ 2,181 $ 1,919
Property, plant and equipment expenditures $ 2,240 $ 2,142 $ 2,127 $ 1,821 $ 1,841
Earnings per share from continuing operations:
Basic $ 3.24 $ 3.32 $ 2.93 $ 2.66 $ 2.41
Diluted 3.22 3.30 2.91 2.64 2.41
Earnings per share
Basic $ 3.24 $ 3.26 $ 2.88 $ 2.61 $ 2.38
Diluted 3.22 3.24 2.86 2.59 2.38
Adjusted earnings per share from continuing operations 1
Basic $ 3.43 $ 3.43 $ 3.20 $ 2.96 $ 2.53
Diluted 3.42 3.41 3.17 2.94 2.53
Balance Sheet:
Assets
Property, plant and equipment, net $ 10,255 $ 9,576 $ 9,114 $ 8,437 $ 8,197
Goodwill 3,751 3,215 3,280 3,108 3,018
Intangible assets 3,211 2,951 2,721 2,591 2,643
Investments 1,487 1,484 1,107 933 563
Other assets 4,897 2,392 2,140 1,964 2,597
$ 23,601 $ 19,618 $ 18,362 $ 17,033 $ 17,018
Liabilities and Shareholders’ Equity
Long-term liabilities $ 14,326 $ 12,848 $ 12,241 $ 10,440 $ 9,997
Current liabilities 4,606 3,002 2,549 2,833 2,748
Total liabilities 18,932 15,850 14,790 13,273 12,745
Shareholders’ equity 4,669 3,768 3,572 3,760 4,273
$ 23,601 $ 19,618 $ 18,362 $ 17,033 $ 17,018
Subscriber count results (000s)
Wireless subscribers 9,503 9,437 9,335 8,977 8,494
Television subscribers 2,127 2,214 2,297 2,305 2,296
Internet subscribers 1,961 1,864 1,793 1,686 1,619
Phone subscribers 1,153 1,074 1,052 1,003 937
Additional wireless metrics
Wireless blended ARPU $ 59.58 $ 59.79 $ 60.20 $ 62.62 $ 63.59
Wireless chum 1.24%1.29%1.32%1.18%1.06%
Ratios:
Revenue growth 2%1%3%4%4%
Adjusted operating profit growth 3%2%2%6%8%
Dividends declared per share $ 1.74 $ 1.58 $ 1.42 $ 1.28 $ 1.16
Dividend payout ratio 254%48%49%49%49%
Dividends as a percentage of pre-tax free cash flow 144%40%39%34%38%
Return on assets 17.1%8.6%8.5%8.8%8.7%
Adjusted net debt/adjusted operating profit 1,2 2.4 2.3 2.2 2.1 2.1
1Adjusted operating profit, adjusted net income, adjusted diluted earnings per share, pre-tax free cash flow and adjusted net debt are Non-GAAP measures and should not be
considered as a substitute or alternative for GAAP measures. These are not defined terms under IFRS, and do not have standard meanings, so may not be a reliable way to compare
us to other companies. See “Non-GAAP Measures” for information about these measures, including how we calculate them.
2As defined. See “Key Performance Indicators”.
2013 ANNUAL REPORT ROGERS COMMUNICATIONS INC. 87