Rogers 2013 Annual Report Download - page 43
Download and view the complete annual report
Please find page 43 of the 2013 Rogers annual report below. You can navigate through the pages in the report by either clicking on the pages listed below, or by using the keyword search tool below to find specific information within the annual report.-
 1
1 -
2
-
3
-
4
-
5
-
6
-
7
-
8
-
9
-
10
-
11
-
12
-
13
-
14
-
15
-
16
-
17
-
18
-
19
-
20
-
21
-
22
-
23
-
24
-
25
-
26
-
27
-
28
-
29
-
30
-
31
-
32
-
 33
33 -
 34
34 -
 35
35 -
 36
36 -
 37
37 -
 38
38 -
 39
39 -
 40
40 -
 41
41 -
 42
42 -
 43
43 -
 44
44 -
 45
45 -
 46
46 -
 47
47 -
 48
48 -
 49
49 -
 50
50 -
 51
51 -
 52
52 -
 53
53 -
54
-
55
-
56
-
57
-
58
-
59
-
60
-
61
-
62
-
63
-
64
-
65
-
66
-
67
-
68
-
69
-
70
-
71
-
72
-
73
-
74
-
75
-
76
-
77
-
78
-
79
-
80
-
81
-
82
-
83
-
84
-
85
-
86
-
87
-
88
-
89
-
90
-
91
-
92
-
93
-
94
-
95
-
96
-
97
-
98
-
99
-
100
-
101
-
102
-
103
-
104
-
105
-
106
-
107
-
108
-
109
-
110
-
111
-
112
-
113
-
114
-
115
-
116
-
117
-
118
-
119
-
120
-
121
-
122
-
123
-
124
-
125
-
126
-
127
-
128
-
129
-
130
-
131
-
132
 |
 |

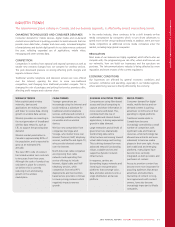
MANAGEMENT’S DISCUSSION AND ANALYSIS
COMPETITION
We compete on quality of service, scope of services, network coverage,
sophistication of wireless technology, breadth of distribution, selection
of devices, branding and positioning, and price.
• Wireless technology: we were the first carrier in Canada to launch an
LTE network catering to customers seeking the increased capacity
and speed it provides. We compete with Bell, Telus MTS and Eastlink,
all of whom operate LTE networks and we expect competition to
grow over time as LTE becomes the prevailing technology in Canada.
We also compete with these providers and other regional providers
such as Wind Mobile, on HSPA and GSM networks and with
providers that use alternative wireless technologies, like Wi-Fi
“hotspots”.
• Product, branding and pricing: we compete nationally with Bell and
Telus. We also complete with newer entrants, various regional
players and resellers.
• Distribution: we compete with other service providers for both
dealers and prime locations for our own stores as well as third party
retail distribution shelf space outlets.
• Wireless networks and handset devices: the parity of wireless devices
across networks has dramatically transformed the competitive
landscape, and we expect this to continue and even intensify.
Consolidation among new entrants or with incumbent carriers could
alter the competitive landscape for Wireless regionally or nationally.
• Spectrum: we are currently participating in an auction for 700 MHz
spectrum. Industry Canada has also announced an auction for
additional 2500 MHz spectrum in 2015 in which we may be
restricted from participating in the geographic areas where we
already hold more than 40 MHz of 2500 MHz spectrum. The
outcomes of both of these auctions may increase competition.
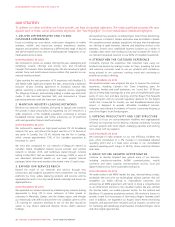
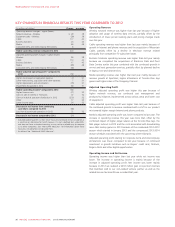
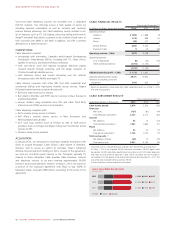
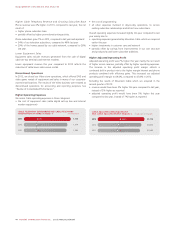
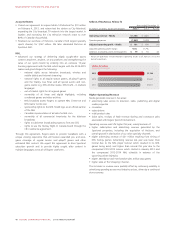
WIRELESS FINANCIAL RESULTS
(In millions of dollars, except percentages)
Years ended December 31
2013 2012 %Chg
Operating revenue
Network revenue $ 6,748 $ 6,719 –
Equipment sales 522 561 (7)
Operating revenue – Wireless 7,270 7,280 –
Operating expenses
Cost of equipment 1(1,535) (1,585) (3)
Other operating expenses (2,578) (2,632) (2)
(4,113) (4,217) (2)
Adjusted operating profit – Wireless $ 3,157 $ 3,063 3
Adjusted operating profit margin as
%of network revenue 46.8%45.6%
Additions to property, plant and equipment $ 865 $ 1,123 (23)
Data revenue included in network revenue $ 3,175 $ 2,722 17
Data revenue as %of network revenue 47%41%
1Includes the cost of equipment sales and direct channel subsidies.
(IN MILLIONS OF DOLLARS)
WIRELESS NETWORK REVENUE
2013
2012
2011
$6,748
$6,719
$6,601
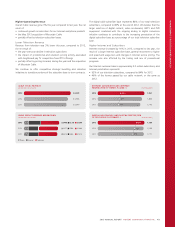
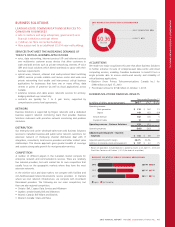
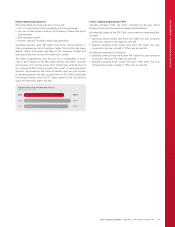
WIRELESS SUBSCRIBER RESULTS 1, 2
(Subscriber statistics in thousands,
except ARPU and churn)
Years ended December 31
2013 2012 Chg
Postpaid
Gross additions 1,409 1,457 (48)
Net additions 228 268 (40)
Total postpaid subscribers 8,074 7,846 228
Monthly churn 1.24%1.29%(0.05)pts
Monthly average revenue per user
(ARPU) $ 67.76 $ 69.30 $ (1.54)
Prepaid
Gross additions 525 627 (102)
Net losses (162) (170) 8
Total prepaid subscribers 1,429 1,591 (162)
Monthly churn 3.85%3.98%(0.13)pts
ARPU $ 15.64 $ 15.84 $ (0.20)
Blended ARPU $ 59.58 $ 59.79 $ (0.21)
1Does not include subscribers from our wireless home phone product.
2ARPU, subscriber counts and subscriber churn are key performance indicators. See
“Key Performance Indicators”.
(IN THOUSANDS)
WIRELESS POSTPAID AND PREPAID SUBSCRIBERS
2013
2012
2011
1,429 8,074
1,591 7,846
1,761 7,574
PostpaidPrepaid
($)
WIRELESS POSTPAID MONTHLY ARPU
2013
2012
2011
$67.76
$69.30
$70.26
(%)
WIRELESS POSTPAID MONTHLY CHURN
2013
2012
2011
1.24%
1.29%
1.32%
Operating Revenue
Our operating revenue depends on the size of our subscriber base, the
average revenue per user and revenue from equipment sales.
Higher Network Revenue
Network revenue includes revenue derived from voice and data services
from postpaid monthly fees, airtime, data usage, long distance charges,
optional service charges, inbound and outbound roaming charges and
certain fees, as well as prepaid usage for airtime, data and other
ancillary charges such as long distance.
2013 ANNUAL REPORT ROGERS COMMUNICATIONS INC. 39