Rogers 2013 Annual Report Download - page 89
Download and view the complete annual report
Please find page 89 of the 2013 Rogers annual report below. You can navigate through the pages in the report by either clicking on the pages listed below, or by using the keyword search tool below to find specific information within the annual report.-
 1
1 -
2
-
3
-
4
-
5
-
6
-
7
-
8
-
9
-
10
-
11
-
12
-
13
-
14
-
15
-
16
-
17
-
18
-
19
-
20
-
21
-
22
-
23
-
24
-
25
-
26
-
27
-
28
-
29
-
30
-
31
-
32
-
33
-
34
-
35
-
36
-
37
-
38
-
39
-
40
-
41
-
42
-
43
-
44
-
45
-
46
-
47
-
48
-
49
-
50
-
51
-
52
-
53
-
54
-
55
-
56
-
57
-
58
-
59
-
60
-
61
-
62
-
63
-
64
-
65
-
66
-
67
-
68
-
69
-
70
-
71
-
72
-
73
-
74
-
75
-
76
-
77
-
78
-
 79
79 -
 80
80 -
 81
81 -
 82
82 -
 83
83 -
 84
84 -
 85
85 -
 86
86 -
 87
87 -
 88
88 -
 89
89 -
 90
90 -
 91
91 -
 92
92 -
 93
93 -
 94
94 -
 95
95 -
 96
96 -
 97
97 -
 98
98 -
 99
99 -
100
-
101
-
102
-
103
-
104
-
105
-
106
-
107
-
108
-
109
-
110
-
111
-
112
-
113
-
114
-
115
-
116
-
117
-
118
-
119
-
120
-
121
-
122
-
123
-
124
-
125
-
126
-
127
-
128
-
129
-
130
-
131
-
132
 |
 |

MANAGEMENT’S DISCUSSION AND ANALYSIS
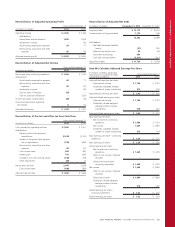
Reconciliation of Adjusted Operating Profit
Years ended December 31
(In millions of dollars) 2013 2012
Operating income $ 2,926 $ 2,766
Add (deduct):
Depreciation and amortization 1,898 1,819
Impairment of assets –80
Stock-based compensation expense 84 77
Restructuring, acquisition and other
expenses 85 92
Adjusted operating profit $ 4,993 $ 4,834
Reconciliation of Adjusted Net Income
Years ended December 31
(In millions of dollars) 2013 2012
Net income from continuing operations $ 1,669 $ 1,725
Add (deduct):
Stock-based compensation expense 84 77
Restructuring, acquisition and other
expenses 85 92
Impairment of assets –80
Gain on sale of TVtropolis (47) –
Gain on spectrum distribution –(233)
Income tax impact of above items (30) (14)
Income tax adjustment, legislative
tax change 854
Adjusted net income $ 1,769 $ 1,781
Reconciliation of Pre-tax and After-tax Free Cash Flow
Years ended December 31
(In millions of dollars) 2013 2012
Cash provided by operating activities $ 3,990 $ 3,421
Add (deduct):
Property, plant and equipment
expenditures (2,240) (2,142)
Interest on long-term debt expense,
net of capitalization (709) (663)
Restructuring, acquisition and other
expenses 85 92
Cash income taxes 496 380
Interest paid 700 680
Change in non-cash working capital (238) 248
Other adjustments (40) 13
Pre-tax free cash flow 2,044 2,029
Cash income taxes (496) (380)
After-tax free cash flow $ 1,548 $ 1,649
Reconciliation of Adjusted Net Debt
(In millions of dollars) December 31, 2013 December 31, 2012
Long-term debt $ 12,173 $ 10,441
Current portion of long-term debt 1,170 348
13,343 10,789
Add (deduct):
Net Debt Derivatives liabilities
(assets) (51) 524
Deferred transaction costs 93 69
Short-term borrowings 650 –
Cash and cash equivalents (2,301) (213)
Adjusted net debt $ 11,734 $ 11,169
How We Calculate Adjusted Earnings Per Share
(In millions of dollars, except per
share amounts; number of shares
outstanding in millions)
Years ended December 31
2013 2012
Adjusted basic earnings per share:
Adjusted net income $ 1,769 $ 1,781
Divided by: weighted average
number of shares outstanding 515 519
Adjusted basic earnings per share $ 3.43 $ 3.43
Adjusted diluted earnings per share:
Adjusted net income $ 1,769 $ 1,781
Divided by: diluted weighted
average number of shares
outstanding 518 522
Adjusted diluted earnings per share $ 3.42 $ 3.41
Basic earnings per share:
Net income from continuing
operations $ 1,669 $ 1,725
Net income 1,669 $ 1,693
Divided by: weighted average
number of shares outstanding 515 519
Basic earnings per share – continuing
operations $ 3.24 $ 3.32
Basic earnings per share $ 3.24 $ 3.26
Diluted earnings per share:
Net income from continuing
operations $ 1,669 $ 1,725
Effect on net income of dilutive
securities ––
Diluted net income from
continuing operations $ 1,669 $ 1,725
Net income $ 1,669 $ 1,693
Effect on net income of dilutive
securities ––
Diluted net income $ 1,669 $ 1,693
Divided by: diluted weighted
average number of shares
outstanding 518 522
Diluted earnings per share –
continuing operations $ 3.22 $ 3.30
Diluted earnings per share $ 3.22 $ 3.24
2013 ANNUAL REPORT ROGERS COMMUNICATIONS INC. 85