Rogers 2013 Annual Report Download - page 58
Download and view the complete annual report
Please find page 58 of the 2013 Rogers annual report below. You can navigate through the pages in the report by either clicking on the pages listed below, or by using the keyword search tool below to find specific information within the annual report.-
 1
1 -
2
-
3
-
4
-
5
-
6
-
7
-
8
-
9
-
10
-
11
-
12
-
13
-
14
-
15
-
16
-
17
-
18
-
19
-
20
-
21
-
22
-
23
-
24
-
25
-
26
-
27
-
28
-
29
-
30
-
31
-
32
-
33
-
34
-
35
-
36
-
37
-
38
-
39
-
40
-
41
-
42
-
43
-
44
-
45
-
46
-
47
-
 48
48 -
 49
49 -
 50
50 -
 51
51 -
 52
52 -
 53
53 -
 54
54 -
 55
55 -
 56
56 -
 57
57 -
 58
58 -
 59
59 -
 60
60 -
 61
61 -
 62
62 -
 63
63 -
 64
64 -
 65
65 -
 66
66 -
 67
67 -
 68
68 -
69
-
70
-
71
-
72
-
73
-
74
-
75
-
76
-
77
-
78
-
79
-
80
-
81
-
82
-
83
-
84
-
85
-
86
-
87
-
88
-
89
-
90
-
91
-
92
-
93
-
94
-
95
-
96
-
97
-
98
-
99
-
100
-
101
-
102
-
103
-
104
-
105
-
106
-
107
-
108
-
109
-
110
-
111
-
112
-
113
-
114
-
115
-
116
-
117
-
118
-
119
-
120
-
121
-
122
-
123
-
124
-
125
-
126
-
127
-
128
-
129
-
130
-
131
-
132
 |
 |
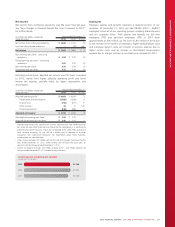
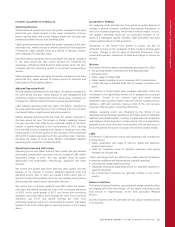
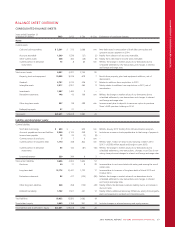
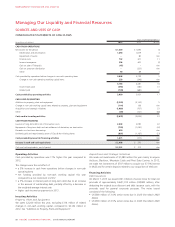
MANAGEMENT’S DISCUSSION AND ANALYSIS
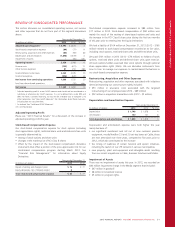
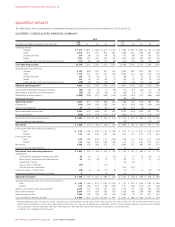
QUARTERLY RESULTS
The table below shows our quarterly consolidated financial results and key performance indicators for 2013 and 2012.
QUARTERLY CONSOLIDATED FINANCIAL SUMMARY
2013 2012
(In millions of dollars, except per share amounts)
Full
Year Q4 Q3 Q2 Q1
Full
Year Q4 Q3 Q2 Q1
Operating revenue
Wireless $ 7,270 $ 1,851 $ 1,846 $ 1,813 $ 1,760 $ 7,280 $ 1,920 $ 1,889 $ 1,765 $ 1,706
Cable 3,475 871 873 870 861 3,358 852 838 843 825
Business Solutions 374 98 93 90 93 351 88 86 90 87
Media 1,704 453 440 470 341 1,620 434 392 440 354
Corporate items and intercompany eliminations (117) (30) (28) (31) (28) (123) (33) (29) (32) (29)
Total operating revenue 12,706 3,243 3,224 3,212 3,027 12,486 3,261 3,176 3,106 2,943
Adjusted operating profit (loss)
Wireless 3,157 696 875 821 765 3,063 687 843 796 737
Cable 1,718 433 425 431 429 1,605 421 403 403 378
Business Solutions 106 29 29 25 23 89 27 22 22 18
Media 161 49 55 64 (7) 190 75 50 79 (14)
Corporate items and intercompany eliminations (149) (40) (43) (35) (31) (113) (34) (30) (24) (25)
Adjusted operating profit 14,993 1,167 1,341 1,306 1,179 4,834 1,176 1,288 1,276 1,094
Stock-based compensation (expense) recovery (84) (18) (7) (1) (58) (77) (57) (26) 12 (6)
Restructuring, acquisition and other expenses (85) (24) (38) (14) (9) (92) (10) (7) (33) (42)
Depreciation and amortization (1,898) (508) (477) (463) (450) (1,819) (453) (437) (466) (463)
Impairment of assets ––––– (80) (80) – – –
Operating income 22,926 617 819 828 662 2,766 576 818 789 583
Finance costs (742) (196) (180) (185) (181) (671) (183) (169) (159) (160)
Other income (expense) 81 14 (3) 60 10 250 241 (6) 7 8
Net income before income taxes 2,265 435 636 703 491 2,345 634 643 637 431
Income tax expense (596) (115) (172) (171) (138) (620) (112) (177) (224) (107)
Net income from continuing operations $ 1,669 $ 320 $ 464 $ 532 $ 353 $ 1,725 $ 522 $ 466 $ 413 $ 324
Loss from discontinued operations ––––– (32) – – (13) (19)
Net income $ 1,669 $ 320 $ 464 $ 532 $ 353 $ 1,693 $ 522 $ 466 $ 400 $ 305
Earnings per share from continuing operations:
Basic $ 3.24 $ 0.62 $ 0.90 $ 1.03 $ 0.69 $ 3.32 $ 1.01 $ 0.90 $ 0.79 $ 0.62
Diluted 3.22 0.62 0.90 0.93 0.68 3.30 1.01 0.90 0.77 0.61
Earnings per share:
Basic 3.24 0.62 0.90 1.03 0.69 3.26 1.01 0.90 0.77 0.58
Diluted 3.22 0.62 0.90 0.93 0.68 3.24 1.01 0.90 0.75 0.57
Net income 1,669 320 464 532 353 1,693 522 466 400 305
Loss from discontinued operations ––––– 32––1319
Net income from continuing operations $ 1,669 $ 320 $ 464 $ 532 $ 353 $ 1,725 $ 522 $ 466 $ 413 $ 324
Add (deduct):
Stock-based compensation expense (recovery) 84 18 7 1 58 77 57 26 (12) 6
Restructuring, acquisition and other expenses 85 24 38 14 9 92 10 7 33 42
Impairment of assets ––––– 8080–––
Gain on sale of TVtropolis (47) – – (47) – –––––
Gain on spectrum distribution –––––(233) (233) – – –
Income tax impact of above items (30) (5) (8) (11) (6) (14) 12 (4) (10) (12)
Income tax adjustment, legislative tax change 8– – 8 – 54 – – 54 –
Adjusted net income 1$ 1,769 $ 357 $ 501 $ 497 $ 414 $ 1,781 $ 448 $ 495 $ 478 $ 360
Adjusted earnings per share from continuing operations 1:
Basic $ 3.43 $ 0.69 $ 0.97 $ 0.97 $ 0.80 $ 3.43 $ 0.87 $ 0.96 $ 0.92 $ 0.69
Diluted 3.42 0.69 0.97 0.96 0.80 3.41 0.86 0.96 0.91 0.68
Additions to property, plant and equipment 2,240 703 548 525 464 2,142 707 528 458 449
Pre-tax free cash flow 12,044 279 620 602 543 2,029 296 589 656 488
After-tax free cash flow 11,548 109 506 505 428 1,649 39 561 633 416
Cash provided by operating activities $ 3,990 $ 1,072 $ 1,052 $ 1,061 $ 805 $ 3,421 $ 668 $ 1,146 $ 1,079 $ 528
1Adjusted operating profit, adjusted net income, adjusted basic and diluted earnings per share, pre-tax free cash flow and after-tax free cash flow are Non-GAAP measures and
should not be considered as a substitute or alternative for GAAP measures. They are not defined terms under IFRS, and do not have standard meanings, so may not be a reliable
way to compare us to other companies. See “Non-GAAP Measures” for information about these measures, including how we calculate them.
2As defined. See “Additional GAAP Measures”.
54 ROGERS COMMUNICATIONS INC. 2013 ANNUAL REPORT