Rogers 2013 Annual Report Download - page 112
Download and view the complete annual report
Please find page 112 of the 2013 Rogers annual report below. You can navigate through the pages in the report by either clicking on the pages listed below, or by using the keyword search tool below to find specific information within the annual report.-
 1
1 -
2
-
3
-
4
-
5
-
6
-
7
-
8
-
9
-
10
-
11
-
12
-
13
-
14
-
15
-
16
-
17
-
18
-
19
-
20
-
21
-
22
-
23
-
24
-
25
-
26
-
27
-
28
-
29
-
30
-
31
-
32
-
33
-
34
-
35
-
36
-
37
-
38
-
39
-
40
-
41
-
42
-
43
-
44
-
45
-
46
-
47
-
48
-
49
-
50
-
51
-
52
-
53
-
54
-
55
-
56
-
57
-
58
-
59
-
60
-
61
-
62
-
63
-
64
-
65
-
66
-
67
-
68
-
69
-
70
-
71
-
72
-
73
-
74
-
75
-
76
-
77
-
78
-
79
-
80
-
81
-
82
-
83
-
84
-
85
-
86
-
87
-
88
-
89
-
90
-
91
-
92
-
93
-
94
-
95
-
96
-
97
-
98
-
99
-
100
-
101
-
 102
102 -
 103
103 -
 104
104 -
 105
105 -
 106
106 -
 107
107 -
 108
108 -
 109
109 -
 110
110 -
 111
111 -
 112
112 -
 113
113 -
 114
114 -
 115
115 -
 116
116 -
 117
117 -
 118
118 -
 119
119 -
 120
120 -
 121
121 -
 122
122 -
123
-
124
-
125
-
126
-
127
-
128
-
129
-
130
-
131
-
132
 |
 |

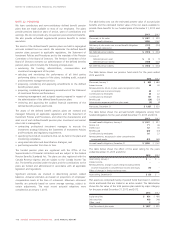
NOTES TO CONSOLIDATED FINANCIAL STATEMENTS
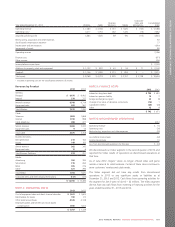
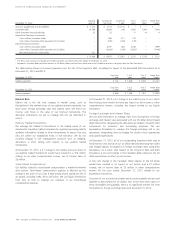
Property, plant and equipment not yet in service and therefore not
depreciated at December 31, 2013 was $882 million (December 31,
2012 – $917 million). Capitalized interest on property, plant and
equipment was recorded at a weighted average rate of approximately
5.1% (2012 – 5.8%).
Depreciation Rates Review
We reviewed depreciation rates for all of our property, plant and
equipment in 2013 and made no changes. In 2012, we changed the
estimates of useful lives of certain network, customer premise
equipment, computer equipment and software assets. We accounted
for the impact of these changes prospectively, resulting in depreciation
expense to be lower by approximately $90 million in 2012 compared to
the amount we would have recorded using the previous useful lives.
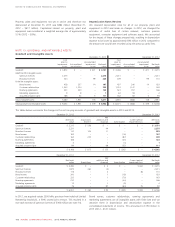
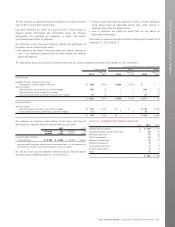
NOTE 13: GOODWILL AND INTANGIBLE ASSETS
Goodwill and Intangible Assets
December 31, 2013 December 31, 2012
Cost
prior to
impairment
losses
Accumulated
amortization
Accumulated
impairment
losses
Net book
value
Cost
prior to
impairment
losses
Accumulated
amortization
Accumulated
impairment
losses
Net book
value
Goodwill $ 3,972 $ – $ 221 $ 3,751 $ 3,436 $ – $ 221 $ 3,215
Indefinite life intangible assets:
Spectrum licences 2,275 – – 2,275 2,231 – – 2,231
Broadcast licences 324 – 99 225 209 – 99 110
Finite life intangible assets:
Brand names 438 257 14 167 437 240 14 183
Customer relationships 1,543 1,234 – 309 1,310 1,147 – 163
Roaming agreements 523 400 – 123 523 357 – 166
Marketing agreements 9 8 – 163 59 – 4
Acquired program rights 168 52 5 111 162 63 5 94
Total intangible assets 5,280 1,951 118 3,211 4,935 1,866 118 2,951
Total goodwill and intangible assets $ 9,252 $ 1,951 $ 339 $ 6,962 $ 8,371 $ 1,866 $ 339 $ 6,166
The tables below summarize the changes in the net carrying amounts of goodwill and intangible assets in 2013 and 2012.
December 31, 2012 December 31, 2013
Net book
value
Acquisitions
(Note 7)
Net
additions and
disposals Amortization
Current period
impairment loss
Net book
value
Goodwill $ 3,215 $ 536 $ – $ – $ – $ 3,751
Spectrum licences 2,231 – 44 – – 2,275
Broadcast licences 110 104 11 – – 225
Brand names 183 – – (16) – 167
Customer relationships 163 233 – (87) – 309
Roaming agreements 166 – – (43) – 123
Marketing agreements 4 – 1 (4) – 1
Acquired program rights 94 – 69 (52) – 111
$ 6,166 $ 873 $ 125 $ (202) $ – $ 6,962
December 31, 2011 December 31, 2012
Net book
value Acquisitions
Net
additions and
disposals Amortization
Current period
impairment loss
Net book
value
Goodwill $ 3,280 $ – $ 2 $ – $ (67) $ 3,215
Spectrum licences 1,875 360 (4) – – 2,231
Broadcast licences 116 – 2 – (8) 110
Brand names 200 – 1 (18) – 183
Customer relationships 232 – 1 (70) – 163
Roaming agreements 210 – – (44) – 166
Marketing agreements 12 – 1 (9) – 4
Acquired program rights 76 – 87 (64) (5) 94
$ 6,001 $ 360 $ 90 $ (205) $ (80) $ 6,166
In 2012, we acquired certain 2500 MHz spectrum from Inukshuk Limited
Partnership (Inukshuk), a 50% owned joint venture. This resulted in a
non-cash increase of spectrum licences of $360 million (see note 14).
Brand names, customer relationships, roaming agreements and
marketing agreements are all intangible assets with finite lives and we
amortize them in depreciation and amortization expense in the
consolidated statements of income. This amounted to $150 million in
2013 (2012 – $141 million).
108 ROGERS COMMUNICATIONS INC. 2013 ANNUAL REPORT