Rogers 2013 Annual Report Download - page 61
Download and view the complete annual report
Please find page 61 of the 2013 Rogers annual report below. You can navigate through the pages in the report by either clicking on the pages listed below, or by using the keyword search tool below to find specific information within the annual report.-
 1
1 -
2
-
3
-
4
-
5
-
6
-
7
-
8
-
9
-
10
-
11
-
12
-
13
-
14
-
15
-
16
-
17
-
18
-
19
-
20
-
21
-
22
-
23
-
24
-
25
-
26
-
27
-
28
-
29
-
30
-
31
-
32
-
33
-
34
-
35
-
36
-
37
-
38
-
39
-
40
-
41
-
42
-
43
-
44
-
45
-
46
-
47
-
48
-
49
-
50
-
 51
51 -
 52
52 -
 53
53 -
 54
54 -
 55
55 -
 56
56 -
 57
57 -
 58
58 -
 59
59 -
 60
60 -
 61
61 -
 62
62 -
 63
63 -
 64
64 -
 65
65 -
 66
66 -
 67
67 -
 68
68 -
 69
69 -
 70
70 -
 71
71 -
72
-
73
-
74
-
75
-
76
-
77
-
78
-
79
-
80
-
81
-
82
-
83
-
84
-
85
-
86
-
87
-
88
-
89
-
90
-
91
-
92
-
93
-
94
-
95
-
96
-
97
-
98
-
99
-
100
-
101
-
102
-
103
-
104
-
105
-
106
-
107
-
108
-
109
-
110
-
111
-
112
-
113
-
114
-
115
-
116
-
117
-
118
-
119
-
120
-
121
-
122
-
123
-
124
-
125
-
126
-
127
-
128
-
129
-
130
-
131
-
132
 |
 |

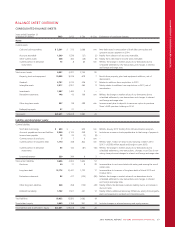
MANAGEMENT’S DISCUSSION AND ANALYSIS
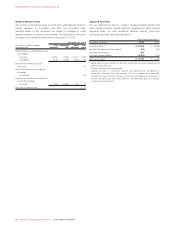
BALANCE SHEET OVERVIEW
CONSOLIDATED BALANCE SHEETS
Years ended December 31
(In millions of dollars) 2013 2012 $ Chg %Chg Explanation of significant changes
Assets
Current assets:
Cash and cash equivalents $ 2,301 $ 213 2,088 n/m New debt raised in anticipation of both debt coming due and
spectrum auction payment in 2014.
Accounts receivable 1,509 1,536 (27) (2) Mainly from collection of accounts receivable.
Other current assets 438 464 (26) (6) Mainly from a decrease in income taxes receivable.
Current portion of derivative
instruments
73 8 65 n/m Reflects the change in market values of our derivatives due to
scheduled settlements, new transactions,and changes in interest
and foreign exchange rates.
Total current assets 4,321 2,221 2,100 95
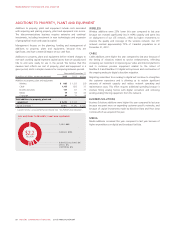
Property, plant and equipment 10,255 9,576 679 7 Results from property, plant and equipment additions, net of
depreciation.
Goodwill 3,751 3,215 536 17 Relates to additions from acquisitions in 2013.
Intangible assets 3,211 2,951 260 9 Mainly relates to additions from acquisitions in 2013, net of
amortization.
Investments 1,487 1,484 3 – –
Derivative instruments 148 42 106 n/m Reflects the change in market values of our derivatives due to
scheduled settlements, new transactions and changes in interest
and foreign exchange rates.
Other long-term assets 397 98 299 n/m Increase mainly due to deposits to secure an option to purchase
Shaw’s AWS spectrum holdings in 2014.
Deferred tax assets 31 31 – – –
Total assets $23,601 $19,618 3,983 20
Liabilities and shareholders’equity
Current liabilities:
Short-term borrowings $ 650 $ – 650 n/m Reflects January 2013 funding from A/R securitization program.
Accounts payable and accrued liabilities 2,344 2,135 209 10 Includes an increase in trade payables due to the timing of payments.
Income taxes payable 22 24 (2) (8) –
Current portion of provisions 77 0 n/m –
Current portion of long-term debt 1,170 348 822 n/m Reflects US$1.1 billion of senior notes maturing in March 2014
(2012 –US$350 million repaid and bought in June 2013).
Current portion of derivative
instruments
63 144 (81) (56) Reflects the change in market values of our derivatives due to
scheduled settlements, new transactions, changes in our Class B non-
voting share price and changes in interest and foreign exchange rates.
Unearned revenue 350 344 6 2 –
Total current liabilities 4,606 3,002 1,604 53
Provisions 40 31 9 29 Increased due to costs associated with exiting and ceasing the use of
certain sites.
Long-term debt 12,173 10,441 1,732 17 Increased due to issuances of long-term debt in March 2013 and
October 2013.
Derivative instruments 83 417 (334) (80) Reflects the change in market values of our derivatives due to
scheduled settlements, new transactions and changes in interest
and foreign exchange rates
Other long-term liabilities 328 458 (130) (28) Mainly reflects the decrease in pension liability due to an increase in
discount rates.
Deferred tax liability 1,702 1,501 201 13 Mainly reflects additional temporary differences arising from property,
plant and equipment, goodwill and intangible assets.
Total liabilities 18,932 15,850 3,082 19
Shareholders’ equity 4,669 3,768 901 24 Includes changes in retained earnings and equity reserves.
Total liabilities and shareholders’ equity $23,601 $19,618 3,983 20
2013 ANNUAL REPORT ROGERS COMMUNICATIONS INC. 57