Rogers 2013 Annual Report Download - page 37
Download and view the complete annual report
Please find page 37 of the 2013 Rogers annual report below. You can navigate through the pages in the report by either clicking on the pages listed below, or by using the keyword search tool below to find specific information within the annual report.-
 1
1 -
2
-
3
-
4
-
5
-
6
-
7
-
8
-
9
-
10
-
11
-
12
-
13
-
14
-
15
-
16
-
17
-
18
-
19
-
20
-
21
-
22
-
23
-
24
-
25
-
26
-
 27
27 -
 28
28 -
 29
29 -
 30
30 -
 31
31 -
 32
32 -
 33
33 -
 34
34 -
 35
35 -
 36
36 -
 37
37 -
 38
38 -
 39
39 -
 40
40 -
 41
41 -
 42
42 -
 43
43 -
 44
44 -
 45
45 -
 46
46 -
 47
47 -
48
-
49
-
50
-
51
-
52
-
53
-
54
-
55
-
56
-
57
-
58
-
59
-
60
-
61
-
62
-
63
-
64
-
65
-
66
-
67
-
68
-
69
-
70
-
71
-
72
-
73
-
74
-
75
-
76
-
77
-
78
-
79
-
80
-
81
-
82
-
83
-
84
-
85
-
86
-
87
-
88
-
89
-
90
-
91
-
92
-
93
-
94
-
95
-
96
-
97
-
98
-
99
-
100
-
101
-
102
-
103
-
104
-
105
-
106
-
107
-
108
-
109
-
110
-
111
-
112
-
113
-
114
-
115
-
116
-
117
-
118
-
119
-
120
-
121
-
122
-
123
-
124
-
125
-
126
-
127
-
128
-
129
-
130
-
131
-
132
 |
 |

MANAGEMENT’S DISCUSSION AND ANALYSIS
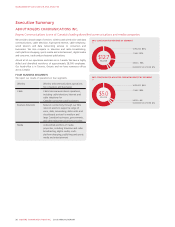
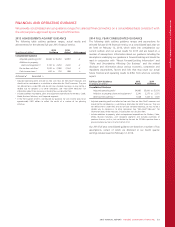
FINANCIAL AND OPERATING GUIDANCE
We provide consolidated annual guidance ranges for selected financial metrics on a consolidated basis consistent with
the annual plans approved by our Board of Directors.
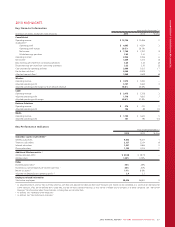
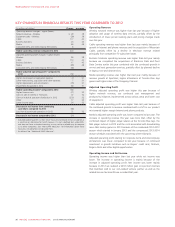
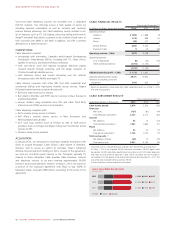
2013 ACHIEVEMENTS AGAINST GUIDANCE
The following table outlines guidance ranges, actual results and
achievements for the selected full year 2013 financial metrics.
(In millions of dollars)
2013
Guidance 2013
Actual Achievement
Consolidated Guidance
Adjusted operating profit 1$4,865 to $5,050 $4,993 ✓
Additions to property,
plant and equipment 22,150 to 2,250 2,240 ✓
Pre-tax free cash flow 12,030 to 2,090 2,044 ✓
Cash income taxes 3650 to 700 496 +
Achieved ✓Exceeded +
1Adjusted operating profit and pre-tax free cash flow are Non-GAAP measures and
should not be considered as a substitute or alternative for GAAP measures. They are
not defined terms under IFRS, and do not have standard meanings, so may not be a
reliable way to compare us to other companies. See “Non-GAAP Measures” for
information about these measures, including how we calculate them.
2Includes additions to property, plant and equipment expenditures for Wireless, Cable,
Media, Business Solutions, and Corporate segments.
3In the third quarter of 2013, we reduced our guidance for cash income taxes to be
approximately $500 million to reflect the results of a number of tax planning
initiatives.
2014 FULL YEAR CONSOLIDATED GUIDANCE
The following table outlines guidance ranges and assumptions for
selected full year 2014 financial metrics, on a consolidated basis that we
set forth on February 12, 2014, which takes into consideration our
current outlook and our actual results for 2013 and are based on a
number of assumptions. Information about our guidance including the
assumptions underlying our guidance is forward-looking and should be
read in conjunction with “About Forward-Looking Information” and
“Risks and Uncertainties Affecting Our Business” and the related
disclosure and information about various economic, competitive and
regulatory assumptions, factors and risks that may cause our actual
future financial and operating results to differ from what we currently
expect.
Full Year 2014 Guidance
(In millions of dollars)
2013
Actual 2014
Guidance
Consolidated Guidance
Adjusted operating profit 1$4,993 $5,000 to $5,150
Additions to property, plant and equipment 22,240 2,275 to 2,375
After-tax free cash flow 11,548 1,425 to 1,500
1Adjusted operating profit and after-tax free cash flow are Non-GAAP measures and
should not be considered as a substitute or alternative for GAAP measures. They are
not defined terms under IFRS, and do not have standard meanings, so may not be a
reliable way to compare us to other companies. See “Non-GAAP Measures” for
information about these measures, including how we calculate them.
2Includes additions to property, plant and equipment expenditures for Wireless, Cable,
Media, Business Solutions, and Corporate segments and excludes purchases of
spectrum licences, such as, but not limited to, the cost for 700MHz spectrum from a
planned national auction in the first half of 2014.
Our 2014 full year consolidated guidance are based on a number of key
assumptions, certain of which we disclosed in our fourth quarter
earnings release issued on February 12, 2014.
2013 ANNUAL REPORT ROGERS COMMUNICATIONS INC. 33