Rogers 2013 Annual Report Download - page 62
Download and view the complete annual report
Please find page 62 of the 2013 Rogers annual report below. You can navigate through the pages in the report by either clicking on the pages listed below, or by using the keyword search tool below to find specific information within the annual report.-
 1
1 -
2
-
3
-
4
-
5
-
6
-
7
-
8
-
9
-
10
-
11
-
12
-
13
-
14
-
15
-
16
-
17
-
18
-
19
-
20
-
21
-
22
-
23
-
24
-
25
-
26
-
27
-
28
-
29
-
30
-
31
-
32
-
33
-
34
-
35
-
36
-
37
-
38
-
39
-
40
-
41
-
42
-
43
-
44
-
45
-
46
-
47
-
48
-
49
-
50
-
51
-
 52
52 -
 53
53 -
 54
54 -
 55
55 -
 56
56 -
 57
57 -
 58
58 -
 59
59 -
 60
60 -
 61
61 -
 62
62 -
 63
63 -
 64
64 -
 65
65 -
 66
66 -
 67
67 -
 68
68 -
 69
69 -
 70
70 -
 71
71 -
 72
72 -
73
-
74
-
75
-
76
-
77
-
78
-
79
-
80
-
81
-
82
-
83
-
84
-
85
-
86
-
87
-
88
-
89
-
90
-
91
-
92
-
93
-
94
-
95
-
96
-
97
-
98
-
99
-
100
-
101
-
102
-
103
-
104
-
105
-
106
-
107
-
108
-
109
-
110
-
111
-
112
-
113
-
114
-
115
-
116
-
117
-
118
-
119
-
120
-
121
-
122
-
123
-
124
-
125
-
126
-
127
-
128
-
129
-
130
-
131
-
132
 |
 |
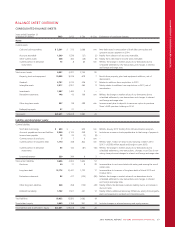
MANAGEMENT’S DISCUSSION AND ANALYSIS
Managing Our Liquidity and Financial Resources
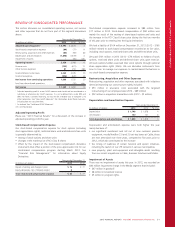
SOURCES AND USES OF CASH
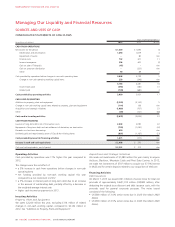
CONSOLIDATED STATEMENTS OF CASH FLOWS
Years ended December 31
(In millions of dollars) 2013 2012 %Chg
CASH FROM OPERATIONS
Net income for the period $ 1,669 $ 1,693 (1)
Depreciation and amortization 1,898 1,819 4
Impairment of assets –80 n/m
Finance costs 742 671 11
Income tax expense 596 610 (2)
Gain on sale of TVtropolis (47) – n/m
Gain on spectrum distribution –(233) n/m
Other 90 89 1
Cash provided by operations before changes in non-cash operating items 4,948 4,729 5
Change in non-cash operating working capital items 238 (248) n/m
5,186 4,481 16
Income taxes paid (496) (380) 31
Interest paid (700) (680) 3
Cash provided by operating activities 3,990 3,421 17
CASHUSED IN INVESTING
Additions to property, plant and equipment (2,240) (2,142) 5
Change in non-cash working capital items related to property, plant and equipment (114) 136 n/m
Acquisitions and strategic initiatives (1,080) (707) 53
Other (39) (121) (68)
Cash used in investing activities (3,473) (2,834) 23
CASH FROM FINANCING
Issuance of long-term debt, net of transaction costs 2,543 2,090 22
Repayment of long-term debt and net settlement of derivatives on termination (725) (1,240) (42)
Proceeds on short-term borrowings 650 – n/m
Dividends paid and repurchase/issuance of Class B Non-Voting shares (897) (1,167) (23)
Cash provided by (used in) financing activities 1,571 (317) n/m
Increase in cash and cash equivalents $ 2,088 $ 270 n/m
Cash and cash equivalents, end of period $ 2,301 $ 213 n/m
Operating Activities
Cash provided by operations was 17%higher this year compared to
2012.
The changes were the net effect of:
•a5%increase in cash from operations before changes in non-cash
operating items
• net funding provided by non-cash working capital this year
compared to a net investment in 2012
•a3%increase in interest paid on long-term debt due to an increase
in the amount of outstanding debt, partially offset by a decrease in
the weighted-average interest rate
• higher cash income tax payments in 2013.
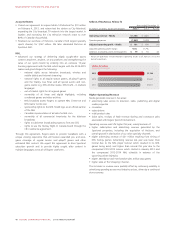
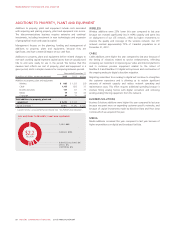
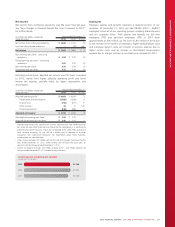
Investing Activities
Property, Plant and Equipment
We spent $2,240 million this year, excluding $114 million of related
changes in non-cash working capital, compared to $2,142 million in
2012. See “Additions to Property, Plant and Equipment”.
Acquisitions and Strategic Initiatives
We made net investments of $1,080 million this year mainly to acquire
theScore, Blackiron, Mountain Cable and Pivot Data Centres. In 2012,
we made net investments of $707 million to acquire our 37.5%interest
in MLSE and for certain deposits related to our acquisition of theScore.
Financing Activities
Debt Issuances
On March 7, 2013 we issued US$1.0 billion of senior notes for total net
proceeds of approximately Cdn$1,015 million (US$985 million), after
deducting the original issue discount and debt issuance costs, with the
proceeds used for general corporate purposes. The notes issued
consisted of the following:
• US$500 million of 3.0%senior notes due in 2023 (the March 2023
Notes)
• US$500 million of 4.5%senior notes due in 2043 (the March 2043
Notes).
58 ROGERS COMMUNICATIONS INC. 2013 ANNUAL REPORT