Rogers 2013 Annual Report Download - page 55
Download and view the complete annual report
Please find page 55 of the 2013 Rogers annual report below. You can navigate through the pages in the report by either clicking on the pages listed below, or by using the keyword search tool below to find specific information within the annual report.-
 1
1 -
2
-
3
-
4
-
5
-
6
-
7
-
8
-
9
-
10
-
11
-
12
-
13
-
14
-
15
-
16
-
17
-
18
-
19
-
20
-
21
-
22
-
23
-
24
-
25
-
26
-
27
-
28
-
29
-
30
-
31
-
32
-
33
-
34
-
35
-
36
-
37
-
38
-
39
-
40
-
41
-
42
-
43
-
44
-
 45
45 -
 46
46 -
 47
47 -
 48
48 -
 49
49 -
 50
50 -
 51
51 -
 52
52 -
 53
53 -
 54
54 -
 55
55 -
 56
56 -
 57
57 -
 58
58 -
 59
59 -
 60
60 -
 61
61 -
 62
62 -
 63
63 -
 64
64 -
 65
65 -
66
-
67
-
68
-
69
-
70
-
71
-
72
-
73
-
74
-
75
-
76
-
77
-
78
-
79
-
80
-
81
-
82
-
83
-
84
-
85
-
86
-
87
-
88
-
89
-
90
-
91
-
92
-
93
-
94
-
95
-
96
-
97
-
98
-
99
-
100
-
101
-
102
-
103
-
104
-
105
-
106
-
107
-
108
-
109
-
110
-
111
-
112
-
113
-
114
-
115
-
116
-
117
-
118
-
119
-
120
-
121
-
122
-
123
-
124
-
125
-
126
-
127
-
128
-
129
-
130
-
131
-
132
 |
 |

MANAGEMENT’S DISCUSSION AND ANALYSIS
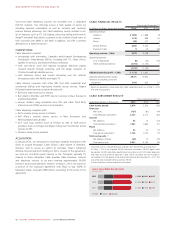
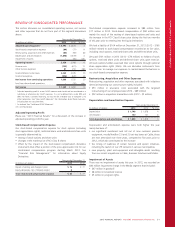
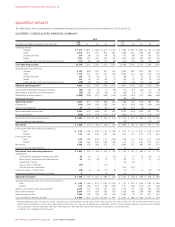
REVIEW OF CONSOLIDATED PERFORMANCE
This section discusses our consolidated operating income, net income
and other expenses that do not form part of the segment discussions
above.
Years ended December 31
(In millions of dollars) 2013 2012 %Chg
Adjusted operating profit 1$ 4,993 $ 4,834 3
Stock-based compensation expense (84) (77) 9
Restructuring, acquisition and other expenses (85) (92) (8)
Depreciation and amortization (1,898) (1,819) 4
Impairment of assets –(80) n/m
Operating income 22,926 2,766 6
Finance costs (742) (671) 11
Other income (expense) 81 250 (68)
Income before income taxes 2,265 2,345 (3)
Income tax expense (596) (620) (4)
Net income from continuing operations 1,669 1,725 (3)
Loss from discontinued operations –(32) n/m
Net income $ 1,669 $ 1,693 (1)
1Adjusted operating profit is a non-GAAP measure and should not be considered as a
substitute or alternative for GAAP measures. It is not a defined term under IFRS and
does not have a standard meaning, so may not be a reliable way to compare us to
other companies. See “Non-GAAP Measures” for information about these measures,
including how we calculate them.
2As defined. See “Additional GAAP Measures”.
n/m: not meaningful.
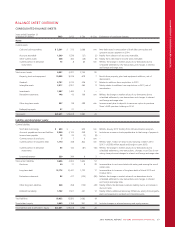
Adjusted Operating Profit
Please see “2013 Financial Results” for a discussion of the increase in
adjusted operating profit this year.
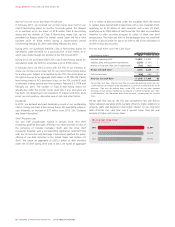
Stock-Based Compensation Expense
Our stock-based compensation expense for stock options (including
stock appreciation rights), restricted share units and deferred share units
is generally determined by:
• vesting of stock options and share units
• changes in the market price of RCI Class B shares
• offset by the impact of the stock-based compensation derivative
instruments that offset a portion of the price appreciation risk for our
stock-based compensation program starting March 2013. See
“Financial Risk Management” for information about Equity
Derivatives.
Years ended December 31
(In millions of dollars) 2013 2012
Impact of vesting and change in price $76 $77
Equity derivatives, net of interest receipt 8–
Total stock-based compensation expense $ 84 $77
Stock-based compensation expense increased to $84 million from
$77 million in 2012. Stock-based compensation of $84 million was
mainly the result of the vesting of share-based options and units and
the increase in the RCI Class B share price during the first two months
of this year prior to entering into the Equity Derivatives.
We had a liability of $164 million at December 31, 2013 (2012 – $195
million) related to stock-based compensation recorded at its fair value,
including stock options, restricted share units and deferred share units.
We paid $101 million in 2013 (2012 – $76 million) to holders of stock
options, restricted share units and deferred share units upon exercise.
All stock options holders exercised their stock options through optional
share appreciation rights (SARs). We use derivative instruments from
time to time to manage our exposure to market-based fluctuations in
our stock-based compensation expense.
Restructuring, Acquisition and Other Expenses
Restructuring, acquisition and other expenses associated with initiatives
aimed at improving our cost structure mainly included:
• $53 million in severance costs associated with the targeted
restructuring of our employee base (2012 – $89 million)
• $32 million in acquisition transaction costs (2012 – $3 million).
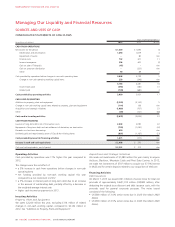
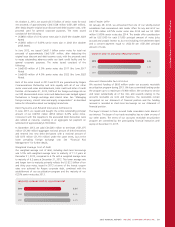
Depreciation and Amortization Expense
Years ended December 31
(In millions of dollars) 2013 2012 %Chg
Depreciation $ 1,748 $ 1,678 4
Amortization 150 141 6
Total depreciation and amortization $ 1,898 $ 1,819 4
Depreciation and amortization expense were both higher this year
mainly because of:
• our significant investment and roll out of new customer premise
equipment, mostly NextBox 2.0 and 3.0 set-top boxes at Cable; these
are now amortized over three years, compared to five years prior to
2012, which also contributed to the increase
• the timing of readiness of certain network and system initiatives,
including the launch of our LTE network in various municipalities
• new property, plant and equipment and intangible assets resulting
from our recent acquisitions in Cable, Business Solutions and Media.
Impairment of Assets
There was no impairment of assets this year. In 2012, we recorded an
$80 million impairment charge in the Media segment that included:
• $67 million in goodwill
• $8 million in broadcast licences
• $5 million in program rights.
2013 ANNUAL REPORT ROGERS COMMUNICATIONS INC. 51