Rogers 2013 Annual Report Download - page 68
Download and view the complete annual report
Please find page 68 of the 2013 Rogers annual report below. You can navigate through the pages in the report by either clicking on the pages listed below, or by using the keyword search tool below to find specific information within the annual report.-
 1
1 -
2
-
3
-
4
-
5
-
6
-
7
-
8
-
9
-
10
-
11
-
12
-
13
-
14
-
15
-
16
-
17
-
18
-
19
-
20
-
21
-
22
-
23
-
24
-
25
-
26
-
27
-
28
-
29
-
30
-
31
-
32
-
33
-
34
-
35
-
36
-
37
-
38
-
39
-
40
-
41
-
42
-
43
-
44
-
45
-
46
-
47
-
48
-
49
-
50
-
51
-
52
-
53
-
54
-
55
-
56
-
57
-
 58
58 -
 59
59 -
 60
60 -
 61
61 -
 62
62 -
 63
63 -
 64
64 -
 65
65 -
 66
66 -
 67
67 -
 68
68 -
 69
69 -
 70
70 -
 71
71 -
 72
72 -
 73
73 -
 74
74 -
 75
75 -
 76
76 -
 77
77 -
 78
78 -
79
-
80
-
81
-
82
-
83
-
84
-
85
-
86
-
87
-
88
-
89
-
90
-
91
-
92
-
93
-
94
-
95
-
96
-
97
-
98
-
99
-
100
-
101
-
102
-
103
-
104
-
105
-
106
-
107
-
108
-
109
-
110
-
111
-
112
-
113
-
114
-
115
-
116
-
117
-
118
-
119
-
120
-
121
-
122
-
123
-
124
-
125
-
126
-
127
-
128
-
129
-
130
-
131
-
132
 |
 |
MANAGEMENT’S DISCUSSION AND ANALYSIS
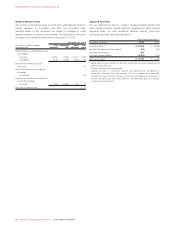
Mark-to-Market Value
We record our derivatives using an estimated credit-adjusted, mark-to-
market valuation, in accordance with IFRS. The estimated credit-
adjusted values of the derivatives are subject to changes in credit
spreads between us and our counterparties. The table below shows the
net asset of our derivative instruments at December 31, 2013:
December 31, 2013
(In millions of dollars, except
exchange rates)
US$
notional Exchange
rate Cdn$
notional Fair
value
Debt Derivatives accounted for as cash
flow hedges:
As assets $ 4,250 1.0285 $ 4,371 $ 184
As liabilities 2,130 1.0769 2,294 (133)
Net mark-to-market asset Debt
Derivatives 51
Equity Derivative not accounted for
as hedges:
As liabilities (13)
Expenditure Derivatives accounted for
as cash flow hedges:
As assets 900 1.0262 923 37
Net mark-to-market asset $ 75
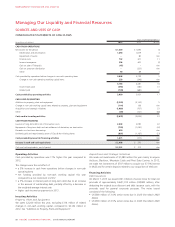
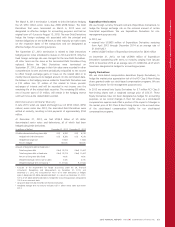
Adjusted Net Debt
We use adjusted net debt to conduct valuation-related analysis and
make capital structure related decisions. Adjusted net debt includes
long-term debt, net debt derivatives liabilities (assets), short-term
borrowings and cash and cash equivalents.
Years ended December 31
(In millions of dollars) 2013 2012
Long-term debt 1,2 $ 13,436 $ 10,858
Net Debt Derivatives liabilities (assets) 2(51) 524
Short-term borrowings 650 —
Cash and cash equivalents (2,301) (213)
Adjusted net debt 3$ 11,734 $ 11,169
1Before deducting any decrease in fair value arising from purchase accounting and
deferred transaction costs.
2Includes current and long-term portions.
3Adjusted net debt is a non-GAAP measure and should not be considered as a
substitute or alternative for GAAP measures. This is not a defined term under IFRS,
and does not have a standard meaning, so may not be a reliable way to compare us
to other companies. See “Non-GAAP Measures” for information about this measure,
including how we calculate it.
64 ROGERS COMMUNICATIONS INC. 2013 ANNUAL REPORT