Rogers 2013 Annual Report Download - page 60
Download and view the complete annual report
Please find page 60 of the 2013 Rogers annual report below. You can navigate through the pages in the report by either clicking on the pages listed below, or by using the keyword search tool below to find specific information within the annual report.-
 1
1 -
2
-
3
-
4
-
5
-
6
-
7
-
8
-
9
-
10
-
11
-
12
-
13
-
14
-
15
-
16
-
17
-
18
-
19
-
20
-
21
-
22
-
23
-
24
-
25
-
26
-
27
-
28
-
29
-
30
-
31
-
32
-
33
-
34
-
35
-
36
-
37
-
38
-
39
-
40
-
41
-
42
-
43
-
44
-
45
-
46
-
47
-
48
-
49
-
 50
50 -
 51
51 -
 52
52 -
 53
53 -
 54
54 -
 55
55 -
 56
56 -
 57
57 -
 58
58 -
 59
59 -
 60
60 -
 61
61 -
 62
62 -
 63
63 -
 64
64 -
 65
65 -
 66
66 -
 67
67 -
 68
68 -
 69
69 -
 70
70 -
71
-
72
-
73
-
74
-
75
-
76
-
77
-
78
-
79
-
80
-
81
-
82
-
83
-
84
-
85
-
86
-
87
-
88
-
89
-
90
-
91
-
92
-
93
-
94
-
95
-
96
-
97
-
98
-
99
-
100
-
101
-
102
-
103
-
104
-
105
-
106
-
107
-
108
-
109
-
110
-
111
-
112
-
113
-
114
-
115
-
116
-
117
-
118
-
119
-
120
-
121
-
122
-
123
-
124
-
125
-
126
-
127
-
128
-
129
-
130
-
131
-
132
 |
 |
MANAGEMENT’S DISCUSSION AND ANALYSIS
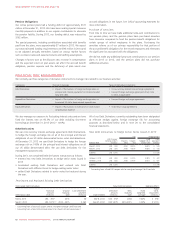
Media
The trends in Media’s results are generally the result of continual
investment in prime-time and specialty programming, higher sports
rights costs, higher subscriber fees, and fluctuations in advertising and
consumer market conditions.
Seasonal fluctuations relate to periods of increased consumer activity
and their impact on advertising and related retail cycles, the MLB
season, where revenues and expenses are concentrated in the spring,
summer and fall months, and the NHL season, where advertising
revenues and programming expenses are concentrated in the fall and
winter months.
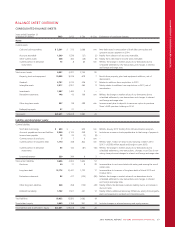
2012 FULL YEAR RESULTS COMPARED TO 2011
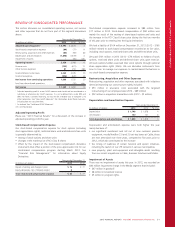
Operating Revenue
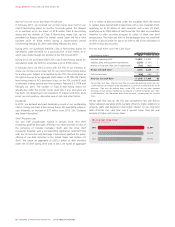
Consolidated revenue increased in 2012 by $140 million from 2011,
Wireless contributed $142 million, Cable contributed $49 million and
Media contributed $9 million, partially offset by decreases in revenue
of $54 million in Business Solutions and in corporate items and
intercompany eliminations of $6 million. The increase was due to
overall higher subscriber levels, data revenue and equipment sales at
Wireless and higher Internet revenue at Cable, partially offset by lower
overall revenue at Business Solutions due to the phased exit of the
legacy services business.
Adjusted Operating Profit
Consolidated adjusted operating profit increased in 2012 by $95 million
from 2011, Wireless contributed $27 million, Cable contributed
$56 million, Business Solutions contributed $3 million, and Media
contributed $10 million. The increases at Wireless and Cable were due
to the revenue growth described above combined with cost efficiencies.
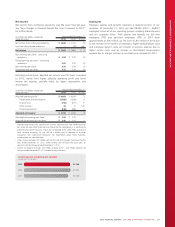
Adjusted Net Income
Consolidated adjusted net income increased to $1,781 million in 2012,
from $1,736 million in 2011, primarily due to increase in adjusted
operating profit of 2%.
56 ROGERS COMMUNICATIONS INC. 2013 ANNUAL REPORT