Rogers 2013 Annual Report Download - page 57
Download and view the complete annual report
Please find page 57 of the 2013 Rogers annual report below. You can navigate through the pages in the report by either clicking on the pages listed below, or by using the keyword search tool below to find specific information within the annual report.-
 1
1 -
2
-
3
-
4
-
5
-
6
-
7
-
8
-
9
-
10
-
11
-
12
-
13
-
14
-
15
-
16
-
17
-
18
-
19
-
20
-
21
-
22
-
23
-
24
-
25
-
26
-
27
-
28
-
29
-
30
-
31
-
32
-
33
-
34
-
35
-
36
-
37
-
38
-
39
-
40
-
41
-
42
-
43
-
44
-
45
-
46
-
 47
47 -
 48
48 -
 49
49 -
 50
50 -
 51
51 -
 52
52 -
 53
53 -
 54
54 -
 55
55 -
 56
56 -
 57
57 -
 58
58 -
 59
59 -
 60
60 -
 61
61 -
 62
62 -
 63
63 -
 64
64 -
 65
65 -
 66
66 -
 67
67 -
68
-
69
-
70
-
71
-
72
-
73
-
74
-
75
-
76
-
77
-
78
-
79
-
80
-
81
-
82
-
83
-
84
-
85
-
86
-
87
-
88
-
89
-
90
-
91
-
92
-
93
-
94
-
95
-
96
-
97
-
98
-
99
-
100
-
101
-
102
-
103
-
104
-
105
-
106
-
107
-
108
-
109
-
110
-
111
-
112
-
113
-
114
-
115
-
116
-
117
-
118
-
119
-
120
-
121
-
122
-
123
-
124
-
125
-
126
-
127
-
128
-
129
-
130
-
131
-
132
 |
 |

MANAGEMENT’S DISCUSSION AND ANALYSIS
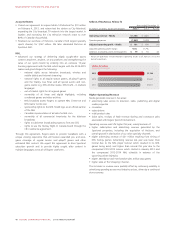
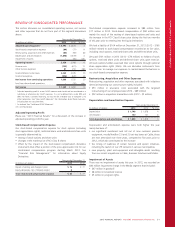
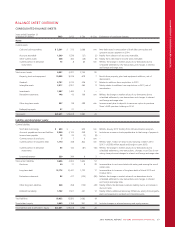
Net Income
Net income from continuing operations was 3%lower than last year.
See “Key Changes in Financial Results this Year Compared to 2012”,
for further details.
(In millions of dollars, except per
share amounts)
Years ended December 31
2013 2012 %Chg
Net income from continuing operations $ 1,669 $ 1,725 (3)
Loss from discontinued operations –(32) n/m
Net income $ 1,669 $ 1,693 $ (1)
Basic earnings per share – continuing
operations $ 3.24 $ 3.32 (2)
Diluted earnings per share – continuing
operations 3.22 3.30 (2)
Basic earnings per share 3.24 3.26 (1)
Diluted earnings per share 3.22 3.24 (1)
Excluding certain items, adjusted net income was 1%lower compared
to 2012, mainly from higher adjusted operating profit and lower
income tax expense, partially offset by higher depreciation and
amortization.
(In millions of dollars, except per
share amounts)
Years ended December 31
2013 2012 %Chg
Adjusted operating profit 1$ 4,993 $ 4,834 3
Depreciation and amortization (1,898) (1,819) 4
Finance costs (742) (671) 11
Other income 234 17 100
Income tax expense 3(618) (580) 7
Adjusted net income 1$ 1,769 $ 1,781 (1)
Adjusted basic earnings per share 1$ 3.43 $ 3.43 –
Adjusted diluted earnings per share 1$ 3.42 $ 3.41 –
1Adjusted operating profit, adjusted net income, adjusted basic and diluted earnings
per share are non-GAAP measures and should not be considered as a substitute or
alternative for GAAP measures. These are not defined terms under IFRS, and do not
have standard meanings, so may not be a reliable way to compare us to other
companies. See “Non-GAAP Measures” for information about these measures,
including how we calculate them.
2Other income excludes $47 million gain on the sale of TVtropolis investment for the
year ended December 31, 2013. Other income also excludes the $233 gain on
spectrum sale for the year ended December 31, 2012.
3Income tax expense excludes $22 million recovery (2012 – $40 million expense) for
the year ended December 31, 2013 related to adjusted items.
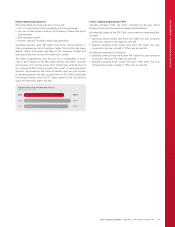
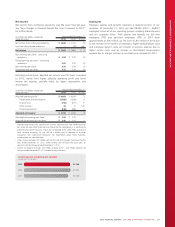
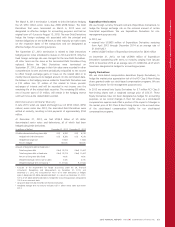
(IN MILLIONS OF DOLLARS)
CONSOLIDATED ADJUSTED NET INCOME
2013
2012
2011
$1,769
$1,781
$1,736
Employees
Employee salaries and benefits represent a material portion of our
expenses. At December 31, 2013, we had 28,026 (2012 – 26,801)
employees across all of our operating groups, including shared services
and the corporate office. Total salaries and benefits for full time
employees (FTE) and part-time employees (PTE) in 2013 were
approximately $1,940 million, up 7%from $1,813 million in 2012 due
to the increase in the number of employees, higher baseball player costs
and employee benefit costs, an increase in pension expense due to
higher service costs, and an increase in stock-based compensation
expense due to a larger increase in our share price compared to 2012.
2013 ANNUAL REPORT ROGERS COMMUNICATIONS INC. 53