Rogers 2013 Annual Report Download - page 5
Download and view the complete annual report
Please find page 5 of the 2013 Rogers annual report below. You can navigate through the pages in the report by either clicking on the pages listed below, or by using the keyword search tool below to find specific information within the annual report.-
 1
1 -
 2
2 -
 3
3 -
 4
4 -
 5
5 -
 6
6 -
 7
7 -
 8
8 -
 9
9 -
 10
10 -
 11
11 -
 12
12 -
 13
13 -
 14
14 -
 15
15 -
 16
16 -
17
-
18
-
19
-
20
-
21
-
22
-
23
-
24
-
25
-
26
-
27
-
28
-
29
-
30
-
31
-
32
-
33
-
34
-
35
-
36
-
37
-
38
-
39
-
40
-
41
-
42
-
43
-
44
-
45
-
46
-
47
-
48
-
49
-
50
-
51
-
52
-
53
-
54
-
55
-
56
-
57
-
58
-
59
-
60
-
61
-
62
-
63
-
64
-
65
-
66
-
67
-
68
-
69
-
70
-
71
-
72
-
73
-
74
-
75
-
76
-
77
-
78
-
79
-
80
-
81
-
82
-
83
-
84
-
85
-
86
-
87
-
88
-
89
-
90
-
91
-
92
-
93
-
94
-
95
-
96
-
97
-
98
-
99
-
100
-
101
-
102
-
103
-
104
-
105
-
106
-
107
-
108
-
109
-
110
-
111
-
112
-
113
-
114
-
115
-
116
-
117
-
118
-
119
-
120
-
121
-
122
-
123
-
124
-
125
-
126
-
127
-
128
-
129
-
130
-
131
-
132
 |
 |

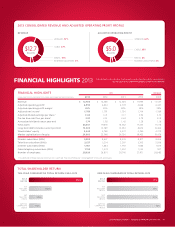
FINANCIAL HIGHLIGHTS 2013
2013 CONSOLIDATED REVENUE AND ADJUSTED OPERATING PROFIT PROFILE
REVENUE ADJUSTED OPERATING PROFIT
(IN MILLIONS OF DOLLARS, EXCEPT PER SHARE, SUBSCRIBER AND EMPLOYEE DATA) 2013 2012 2011 2010 2009
Revenue $ 12,706 $ 12,486 $ 12,346 $ 11,999 $ 11,537
Adjusted operating profit 1 4,993 4,834 4,739 4,668 4,407
Adjusted operating profit margin 1 39% 39% 38% 39% 38%
Adjusted net income 1 1,769 1,781 1,736 1,704 1,569
Adjusted diluted earnings per share 1 3.42 3.41 3.17 2.94 2.53
Pre-tax free cash flow per share 1 3.97 3.91 3.63 3.79 3.09
Annualized dividend rate at year-end 1.74 1.58 1.42 1.28 1.16
Total assets 23,601 19,618 18,362 17,033 17,018
Long-term debt (includes current portion) 13,343 10,789 10,034 8,654 8,464
Shareholders’ equity 4,669 3,768 3,572 3,760 4,273
Market capitalization of equity 24,903 23,346 20,736 19,435 19,476
Wireless subscribers (000s) 9,503 9,437 9,335 8,977 8,494
Television subscribers (000s) 2,127 2,214 2,297 2,305 2,296
Internet subscribers (000s) 1,961 1,864 1,793 1,686 1,619
Cable telephony subscribers (000s) 1,153 1,074 1,052 1,003 937
Number of employees 28,026 26,801 28,745 27,971 28,985
FINANCIAL HIGHLIGHTS
TOTAL SHAREHOLDER RETURN
TEN-YEAR COMPARATIVE TOTAL RETURN: 2004–2013 ONE-YEAR COMPARATIVE TOTAL RETURN: 2013
IFRS CDN GAAP
FOR A DETAILED DISCUSSION OF OUR FINANCIAL AND OPERATING METRICS AND RESULTS,
PLEASE SEE THE ACCOMPANYING MD&A LATER IN THIS REPORT.
TSX
TELECOM
INDEX 193%
S&P
TELECOM
INDEX 119%
S&P/TSX
COMPOSITE
INDEX 115%
TSX
TELECOM
INDEX 11%
S&P
TELECOM
INDEX 11%
S&P/TSX
COMPOSITE
INDEX 13%
RCI.B
ON TSX
RCI.B
ON TSX
470% 11%
WIRELESS 57%
CABLE 27%
MEDIA 13%
BUSINESS SOLUTIONS 3%
$12.7
BILLI
O
N$5.0
BILLI
O
N
WIRELESS 61%
MEDIA 4%
BUSINESS SOLUTIONS 2%
CABLE 33%
1 For a definition of these measures (which are non-GAAP) see “Non-GAAP Measures” in Management’s Discussion and Analysis.
2013 ANNUAL REPORT ROGERS COMMUNICATIONS INC. 01