Rogers 2013 Annual Report Download - page 44
Download and view the complete annual report
Please find page 44 of the 2013 Rogers annual report below. You can navigate through the pages in the report by either clicking on the pages listed below, or by using the keyword search tool below to find specific information within the annual report.-
 1
1 -
2
-
3
-
4
-
5
-
6
-
7
-
8
-
9
-
10
-
11
-
12
-
13
-
14
-
15
-
16
-
17
-
18
-
19
-
20
-
21
-
22
-
23
-
24
-
25
-
26
-
27
-
28
-
29
-
30
-
31
-
32
-
33
-
 34
34 -
 35
35 -
 36
36 -
 37
37 -
 38
38 -
 39
39 -
 40
40 -
 41
41 -
 42
42 -
 43
43 -
 44
44 -
 45
45 -
 46
46 -
 47
47 -
 48
48 -
 49
49 -
 50
50 -
 51
51 -
 52
52 -
 53
53 -
 54
54 -
55
-
56
-
57
-
58
-
59
-
60
-
61
-
62
-
63
-
64
-
65
-
66
-
67
-
68
-
69
-
70
-
71
-
72
-
73
-
74
-
75
-
76
-
77
-
78
-
79
-
80
-
81
-
82
-
83
-
84
-
85
-
86
-
87
-
88
-
89
-
90
-
91
-
92
-
93
-
94
-
95
-
96
-
97
-
98
-
99
-
100
-
101
-
102
-
103
-
104
-
105
-
106
-
107
-
108
-
109
-
110
-
111
-
112
-
113
-
114
-
115
-
116
-
117
-
118
-
119
-
120
-
121
-
122
-
123
-
124
-
125
-
126
-
127
-
128
-
129
-
130
-
131
-
132
 |
 |

MANAGEMENT’S DISCUSSION AND ANALYSIS
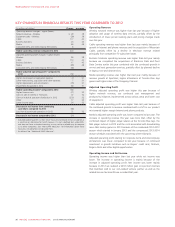
Network revenue was higher this year compared to last year. This was
the net effect of:
• higher data revenue related to an increase in subscriber levels and
higher usage of wireless data services
• partially offset by our introduction of new lower priced US and
international roaming plans and rates which offer consumers more
value, and
• the continued adoption of customer friendly simplified plans, which
often bundle in certain features like voicemail, caller ID and long
distance that we have charged for separately in the past.
Excluding the decline in US and international roaming revenue this year,
network revenue would have increased 1%.
Data revenue was 17%higher this year mainly because of the
continued penetration and growing use of smartphones, tablet devices
and wireless laptops, which increased the use of e-mail, wireless,
Internet access, text messaging and other wireless data services. Data
revenue represented approximately 47%of total network revenue this
year, compared to approximately 41%last year.
Postpaid churn was 1.24%this year, compared to 1.29%in 2012. The
lower churn rate is partly attributable to the new simplified plans and
the roaming plans we introduced.
Gross postpaid subscriber additions were 1.4 million this year, or 3%
lower than last year, which reduced net postpaid subscriber additions to
228,000, despite a lower postpaid churn. We believe the industry
transition from three year to two year plans resulting from the recent
adoption of the Canadian Radio-television and Telecommunications
Commission (CRTC) Wireless Code may have slowed our overall
wireless subscriber growth from the second half of the year. See
“Regulation in Our Industry” for more information on the Wireless
Code.
We activated and upgraded approximately 2.7 million smartphones this
year, compared to approximately 2.9 million in 2012. Approximately
34%of these were for new subscribers. The decrease was mainly
because there was a 10%reduction in hardware upgrades by existing
subscribers during the year, which we also believe is at least partly due
to the move from three to two year contracts and the associated pricing
changes.
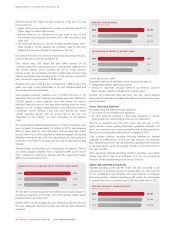
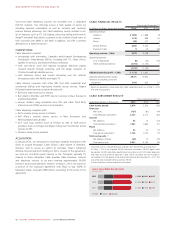
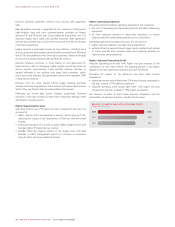
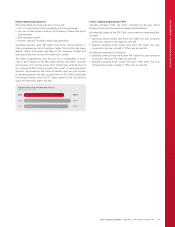
The percentage of subscribers with smartphones increased to 75%of
our overall postpaid subscriber base, compared to 69%at the end of
2012. Smartphone subscribers typically generate significantly higher
ARPU and are less likely to churn.
(%)
SMARTPHONES AS A PERCENTAGE OF POSTPAID SUBSCRIBERS
2013
2012
2011
75%
69%
56%
The decrease in prepaid subscriber net additions was mainly because of
increasing competition at the lower end of the wireless market where
prepaid products are mainly sold.
Blended ARPU was down slightly this year compared to last year because
the voice component declined at a faster rate than the data component
increased.
(IN MILLIONS OF DOLLARS)
WIRELESS DATA REVENUE
2013
2012
2011
$3,175
$2,722
$2,325
(%)
DATA REVENUE PERCENT OF BLENDED ARPU
2013
2012
2011
47%
41%
35%
Lower Equipment Sales
Equipment sales (net of subsidies) include revenue from sales to:
• independent dealers, agents and retailers
• directly to subscribers through fulfillment by Wireless’ customer
service groups, websites, telesales and corporate stores.
Revenue from equipment sales was lower this year, mainly because
fewer existing subscribers upgraded their devices and there were fewer
gross activations.
Lower Operating Expenses
We assess operating expenses in two categories:
• the cost of wireless handsets and equipment
• all other expenses involved in day-to-day operations, to service
existing subscriber relationships and attract new subscribers.
The cost of equipment was $50 million lower than last year, or 3%,
mainly because fewer existing subscribers upgraded hardware and
fewer new customers were added during the year as discussed above.
We activated and upgraded fewer devices compared to 2012.
Total customer retention spending (including subsidies on handset
upgrades) was $939 million, 0.3%lower than last year. The reduction
was mainly because fewer existing subscribers upgraded their hardware
as discussed above, which we partially attribute to the recent shift to
two year contracts.
Other operating expenses (excluding retention spending), were down
slightly from 2012, due to a continued focus on cost productivity
initiatives we are implementing across various functions.
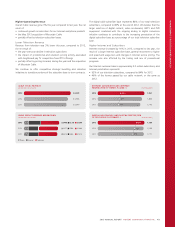
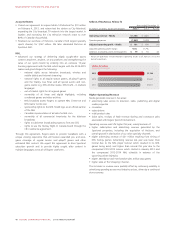
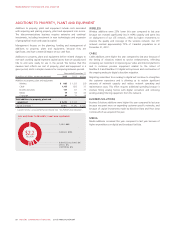
Higher Adjusted Operating Profit
Adjusted operating profit was 3%higher this year compared to last
year because of continued growth of wireless data, our improvements
in cost management and efficiency and lower volumes of hardware
sales and upgrades. Adjusted operating profit margin as a percentage
of network revenue increased this year to 46.8%from 45.6%in 2012.
(IN MILLIONS OF DOLLARS)
WIRELESS ADJUSTED OPERATING PROFIT
2013
2012
2011
$3,157
$3,063
$3,036
40 ROGERS COMMUNICATIONS INC. 2013 ANNUAL REPORT