Rogers 2013 Annual Report Download - page 119
Download and view the complete annual report
Please find page 119 of the 2013 Rogers annual report below. You can navigate through the pages in the report by either clicking on the pages listed below, or by using the keyword search tool below to find specific information within the annual report.-
 1
1 -
2
-
3
-
4
-
5
-
6
-
7
-
8
-
9
-
10
-
11
-
12
-
13
-
14
-
15
-
16
-
17
-
18
-
19
-
20
-
21
-
22
-
23
-
24
-
25
-
26
-
27
-
28
-
29
-
30
-
31
-
32
-
33
-
34
-
35
-
36
-
37
-
38
-
39
-
40
-
41
-
42
-
43
-
44
-
45
-
46
-
47
-
48
-
49
-
50
-
51
-
52
-
53
-
54
-
55
-
56
-
57
-
58
-
59
-
60
-
61
-
62
-
63
-
64
-
65
-
66
-
67
-
68
-
69
-
70
-
71
-
72
-
73
-
74
-
75
-
76
-
77
-
78
-
79
-
80
-
81
-
82
-
83
-
84
-
85
-
86
-
87
-
88
-
89
-
90
-
91
-
92
-
93
-
94
-
95
-
96
-
97
-
98
-
99
-
100
-
101
-
102
-
103
-
104
-
105
-
106
-
107
-
108
-
 109
109 -
 110
110 -
 111
111 -
 112
112 -
 113
113 -
 114
114 -
 115
115 -
 116
116 -
 117
117 -
 118
118 -
 119
119 -
 120
120 -
 121
121 -
 122
122 -
 123
123 -
 124
124 -
 125
125 -
 126
126 -
 127
127 -
 128
128 -
 129
129 -
130
-
131
-
132
 |
 |

NOTES TO CONSOLIDATED FINANCIAL STATEMENTS
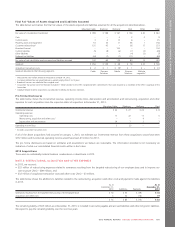
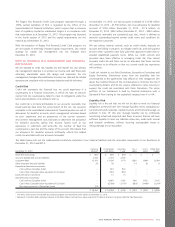
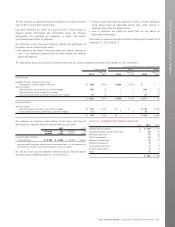
Derivative Instruments
At December 31, 2013, all of our US dollar-denominated long-term
debt instruments were hedged against fluctuations in foreign exchange
rates for accounting purposes (2012 – 91.7%).
The tables below show our Derivatives net asset (liability) position at
December 31, 2013 and 2012.
December 31, 2013
US $
notional
Exchange
rate
Cdn $
notional
Fair
value
Debt Derivatives accounted for
as cash flow hedges:
As assets $ 4,250 1.0285 $ 4,371 $ 184
As liabilities 2,130 1.0769 2,294 (133)
Net mark-to-market asset Debt
Derivatives 51
Equity Derivatives not accounted
for as cash flow hedges:
As liabilities (13)
Expenditure Derivatives accounted
for as cash flow hedges:
As assets 900 1.0262 923 37
Net mark-to-market asset $ 75
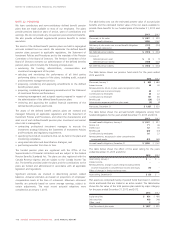
December 31, 2012
US $
notional
Exchange
rate
Cdn $
notional
Fair
value
Debt Derivatives accounted for
as cash flow hedges:
As assets $ 1,600 1.0252 $ 1,640 $ 34
As liabilities 2,280 1.2270 2,798 (561)
Debt Derivatives not accounted
for as cash flow hedges:
As assets 350 1.0258 359 3
Net mark-to-market liability Debt
Derivatives (524)
Expenditure Derivatives accounted
for as cash flow hedges:
As assets 380 0.9643 366 13
Net mark-to-market liability $ (511)
The table below shows derivative instruments asset and derivative
instruments liability reflected in our consolidated statements of financial
position.
2013 2012
Current asset $73 $8
Long-term asset 148 42
221 50
Current liability (63) (144)
Long-term liability (83) (417)
(146) (561)
Net mark-to-market asset (liability) $75 $ (511)
In 2013, we recorded a $4 million increase to net income related to
hedge ineffectiveness (2012 – $4 million decrease).
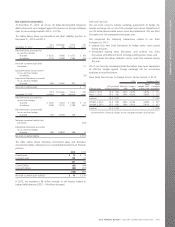
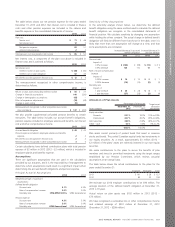
Debt Derivatives
We use cross currency interest exchange agreements to hedge the
foreign exchange risk on all of the principal and interest obligations of
our US dollar-denominated senior notes and debentures. We use Debt
Derivatives for risk-management purposes only.
We completed the following transactions related to our Debt
Derivatives in 2013:
• entered into new Debt Derivatives to hedge senior notes issued
during the year,
• terminated existing Debt Derivatives and entered into Debt
Derivatives with different terms to hedge existing senior notes, and
• settled Debt Derivatives related to senior notes that matured during
the year.
All of our currently outstanding Debt Derivatives have been designated
as effective hedges against foreign exchange risk for accounting
purposes as described below.
New Debt Derivatives to Hedge Senior Notes Issued in 2013
US $ Hedging effect
Effective date
US$ principal/
notional amount
Maturity
date
Coupon
rate
Fixed
hedged Cdn$
interest rate 1
Fixed
Canadian
equivalent
March 7, 2013 US $ 500 2023 3.00% 3.60% $ 515
March 7, 2013 US $ 500 2043 4.50% 4.60% $ 515
Subtotal US $ 1,000 $ 1,030
October 2, 2013 US $ 850 2023 4.10% 4.59% $ 877
October 2, 2013 US $ 650 2043 5.45% 5.61% $ 671
Subtotal US $ 1,500 $ 1,548
1Converting from a fixed US$ coupon rate to a weighted average Cdn$ fixed rate.
2013 ANNUAL REPORT ROGERS COMMUNICATIONS INC. 115