Rogers 2013 Annual Report Download - page 31
Download and view the complete annual report
Please find page 31 of the 2013 Rogers annual report below. You can navigate through the pages in the report by either clicking on the pages listed below, or by using the keyword search tool below to find specific information within the annual report.-
 1
1 -
2
-
3
-
4
-
5
-
6
-
7
-
8
-
9
-
10
-
11
-
12
-
13
-
14
-
15
-
16
-
17
-
18
-
19
-
20
-
 21
21 -
 22
22 -
 23
23 -
 24
24 -
 25
25 -
 26
26 -
 27
27 -
 28
28 -
 29
29 -
 30
30 -
 31
31 -
 32
32 -
 33
33 -
 34
34 -
 35
35 -
 36
36 -
 37
37 -
 38
38 -
 39
39 -
 40
40 -
 41
41 -
42
-
43
-
44
-
45
-
46
-
47
-
48
-
49
-
50
-
51
-
52
-
53
-
54
-
55
-
56
-
57
-
58
-
59
-
60
-
61
-
62
-
63
-
64
-
65
-
66
-
67
-
68
-
69
-
70
-
71
-
72
-
73
-
74
-
75
-
76
-
77
-
78
-
79
-
80
-
81
-
82
-
83
-
84
-
85
-
86
-
87
-
88
-
89
-
90
-
91
-
92
-
93
-
94
-
95
-
96
-
97
-
98
-
99
-
100
-
101
-
102
-
103
-
104
-
105
-
106
-
107
-
108
-
109
-
110
-
111
-
112
-
113
-
114
-
115
-
116
-
117
-
118
-
119
-
120
-
121
-
122
-
123
-
124
-
125
-
126
-
127
-
128
-
129
-
130
-
131
-
132
 |
 |

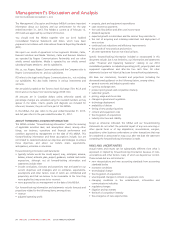
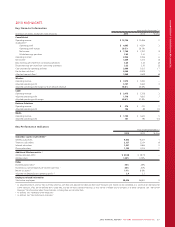
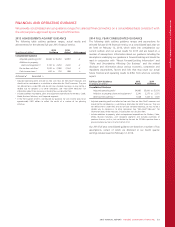
MANAGEMENT’S DISCUSSION AND ANALYSIS
2013 HIGHLIGHTS
Key Financial Information
Years ended December 31
(In millions of dollars, except per share amounts) 2013 2012 %Chg
Consolidated
Operating revenue $ 12,706 $ 12,486 2
As adjusted 1:
Operating profit $ 4,993 $ 4,834 3
Operating profit margin 39.3%38.7%
Net income $ 1,769 $ 1,781 (1)
Diluted earnings per share 3.42 3.41 –
Operating income 22,926 2,766 6
Net income 1,669 1,725 (3)
Basic earnings per share from continuing operations 3.24 3.32 (2)
Diluted earnings per share from continuing operations 3.22 3.30 (2)
Cash provided by operating activities 3,990 3,421 17
Pre-tax free cash flow 12,044 2,029 1
After-tax free cash flow 11,548 1,649 (6)
Wireless
Operating revenue $ 7,270 $ 7,280 –
Adjusted operating profit 3,157 3,063 3
Adjusted operating profit margin as %of network revenue 46.8%45.6%
Cable
Operating revenue $ 3,475 $ 3,358 3
Adjusted operating profit 1,718 1,605 7
Adjusted operating profit margin 49.4%47.8%
Business Solutions
Operating revenue $ 374 $ 351 7
Adjusted operating profit 106 89 19
Media
Operating revenue $ 1,704 $ 1,620 5
Adjusted operating profit 161 190 (15)
Key Performance Indicators
Years ended December 31
2013 2012 %Chg
Subscriber counts results (000s) 3
Wireless subscribers 9,503 9,437 1
Television subscribers 2,127 2,214 (4)
Internet subscribers 1,961 1,864 5
Phone subscribers 1,153 1,074 7
Additional Wireless metrics 3
Wireless blended ARPU $ 59.58 $ 59.79 –
Wireless churn 1.24%1.29%
Ratios
Dividend payout ratio 354%48%
Dividends as a percentage of pre-tax free cash flow 144%40%
Return on assets 37.1%8.6%
Adjusted net debt/adjusted operating profit 1,3 2.4 2.3
Employee-related information
Total active employees 28,026 26,801 5
1As adjusted amounts, pre-tax free cash flow, after-tax cash flow and adjusted net debt are Non-GAAP measures and should not be considered as a substitute or alternative for
GAAP measures. They are not defined terms under IFRS, and do not have standard meanings, so may not be a reliable way to compare us to other companies. See “Non-GAAP
Measures” for information about these measures, including how we calculate them.
2As defined. See “Additional GAAP Measures”.
3As defined. See “Key Performance Indicators”.
2013 ANNUAL REPORT ROGERS COMMUNICATIONS INC. 27