Rogers 2013 Annual Report Download - page 87
Download and view the complete annual report
Please find page 87 of the 2013 Rogers annual report below. You can navigate through the pages in the report by either clicking on the pages listed below, or by using the keyword search tool below to find specific information within the annual report.-
 1
1 -
2
-
3
-
4
-
5
-
6
-
7
-
8
-
9
-
10
-
11
-
12
-
13
-
14
-
15
-
16
-
17
-
18
-
19
-
20
-
21
-
22
-
23
-
24
-
25
-
26
-
27
-
28
-
29
-
30
-
31
-
32
-
33
-
34
-
35
-
36
-
37
-
38
-
39
-
40
-
41
-
42
-
43
-
44
-
45
-
46
-
47
-
48
-
49
-
50
-
51
-
52
-
53
-
54
-
55
-
56
-
57
-
58
-
59
-
60
-
61
-
62
-
63
-
64
-
65
-
66
-
67
-
68
-
69
-
70
-
71
-
72
-
73
-
74
-
75
-
76
-
 77
77 -
 78
78 -
 79
79 -
 80
80 -
 81
81 -
 82
82 -
 83
83 -
 84
84 -
 85
85 -
 86
86 -
 87
87 -
 88
88 -
 89
89 -
 90
90 -
 91
91 -
 92
92 -
 93
93 -
 94
94 -
 95
95 -
 96
96 -
 97
97 -
98
-
99
-
100
-
101
-
102
-
103
-
104
-
105
-
106
-
107
-
108
-
109
-
110
-
111
-
112
-
113
-
114
-
115
-
116
-
117
-
118
-
119
-
120
-
121
-
122
-
123
-
124
-
125
-
126
-
127
-
128
-
129
-
130
-
131
-
132
 |
 |

MANAGEMENT’S DISCUSSION AND ANALYSIS
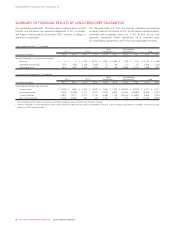
Capital Intensity
Capital intensity allows us to compare the level of our additions to
property, plant and equipment to that of other companies within the
same industry. We calculate it by dividing additions to property, plant
and equipment by operating revenue. For Wireless, capital intensity is
calculated using total network revenue. We use it to evaluate the
performance of our assets and when making decisions about the capital
expenditures. We believe that certain investors and analysts use capital
intensity to measure the performance of asset purchases and
construction in relation to revenue.
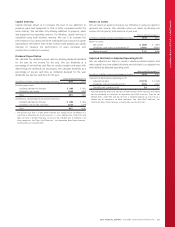
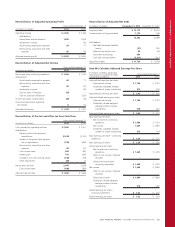
Dividend Payout Ratios
We calculate the dividend payout ratio by dividing dividends declared
for the year by net income for the year. We use dividends as a
percentage of pre-tax free cash flow to conduct analysis and assist with
determining the dividends we should pay. We calculate dividends as a
percentage of pre-tax cash flow as dividends declared for the year
divided by pre-tax free cash flow for the year.
Years ended December 31
(In millions of dollars, except percentages and ratios) 2013 2012
Dividend payout ratio
Dividends declared for the year $ 896 $ 820
Divided by: net income 1,669 1,693
Ratio 54%48%
Dividends as a percentage of pre-tax free cash flow
Dividends declared for the year $ 896 $ 820
Divided by: pre-tax free cash flow 12,044 2,029
Ratio 44%40%
1Pre-tax free cash flow is a Non-GAAP measure and should not be considered as a
substitute or alternative for GAAP measures. It is not a defined term under IFRS, and
does not have a standard meaning, so may not be a reliable way to compare us to
other companies. See “Non-GAAP Measures” for information about these measures,
including how we calculate them.
Return on Assets
We use return on assets to measure our efficiency in using our assets to
generate net income. We calculate return on assets by dividing net
income for the year by total assets as at year end.
Years ended December 31
(In millions of dollars, except percentages and ratios) 2013 2012
Return on assets
Net income $ 1,669 $ 1,693
Divided by: total assets as at December 31 23,601 19,618
Return on assets 7.1%8.6%
Adjusted Net Debt to Adjusted Operating Profit
We use adjusted net debt to conduct valuation-related analysis and
make capital structure related decisions and calculate it as adjusted net
debt divided by adjusted operating profit.
Years ended December 31
(In millions of dollars, except percentages and ratios) 2013 2012
Adjusted net debt/adjusted operating profit
Adjusted net debt $11,734 $11,169
Divided by: adjusted operating profit 14,993 4,834
Debt/adjusted operating profit 2.4 2.3
1Adjusted operating profit and adjusted net debt are Non-GAAP measures and should
not be considered as substitutes or alternatives for GAAP measures. They are not
defined terms under IFRS, and do not have a standard meaning, so may not be a
reliable way to compare us to other companies. See “Non-GAAP Measures” for
information about these measures, including how we calculate them.
2013 ANNUAL REPORT ROGERS COMMUNICATIONS INC. 83