Rogers 2013 Annual Report Download - page 113
Download and view the complete annual report
Please find page 113 of the 2013 Rogers annual report below. You can navigate through the pages in the report by either clicking on the pages listed below, or by using the keyword search tool below to find specific information within the annual report.-
 1
1 -
2
-
3
-
4
-
5
-
6
-
7
-
8
-
9
-
10
-
11
-
12
-
13
-
14
-
15
-
16
-
17
-
18
-
19
-
20
-
21
-
22
-
23
-
24
-
25
-
26
-
27
-
28
-
29
-
30
-
31
-
32
-
33
-
34
-
35
-
36
-
37
-
38
-
39
-
40
-
41
-
42
-
43
-
44
-
45
-
46
-
47
-
48
-
49
-
50
-
51
-
52
-
53
-
54
-
55
-
56
-
57
-
58
-
59
-
60
-
61
-
62
-
63
-
64
-
65
-
66
-
67
-
68
-
69
-
70
-
71
-
72
-
73
-
74
-
75
-
76
-
77
-
78
-
79
-
80
-
81
-
82
-
83
-
84
-
85
-
86
-
87
-
88
-
89
-
90
-
91
-
92
-
93
-
94
-
95
-
96
-
97
-
98
-
99
-
100
-
101
-
102
-
 103
103 -
 104
104 -
 105
105 -
 106
106 -
 107
107 -
 108
108 -
 109
109 -
 110
110 -
 111
111 -
 112
112 -
 113
113 -
 114
114 -
 115
115 -
 116
116 -
 117
117 -
 118
118 -
 119
119 -
 120
120 -
 121
121 -
 122
122 -
 123
123 -
124
-
125
-
126
-
127
-
128
-
129
-
130
-
131
-
132
 |
 |

NOTES TO CONSOLIDATED FINANCIAL STATEMENTS
We amortize the costs of acquired program rights over the expected
performances of the related programs, recording them in other external
purchases in operating costs in the consolidated statements of income.
This amounted to $52 million in 2013 (2012 – $64 million).
Impairment
Goodwill and Indefinite Life Intangible Assets
We test cash generating units or groups of cash generating units with
allocated goodwill and/or indefinite life intangible assets for impairment
as at October 1 of each calendar year. When assessing whether or not
there is impairment, we determine the recoverable amount of a cash
generating unit based on the greater of its value in use or its fair value
less costs to sell.
We estimate an asset’s value in use by:
• Discounting estimated future cash flows to their present value. We
estimate the discounted future cash flows for periods of up to five
years, depending on the cash generating unit, and a terminal value.
• The future cash flows are based on our estimates and expected
future operating results of the cash generating unit after considering,
economic conditions and a general outlook for the cash generating
unit’s industry.
• Our discount rates consider market rates of return, debt to equity
ratios and certain risk premiums, among other things.
• The terminal value is the value attributed to the cash generating
unit’s operations beyond the projected time period of the cash flows
using a perpetuity rate based on expected economic conditions and a
general outlook for the industry.
We determine its fair value less costs to sell in one of two ways:
•Analyzing discounted cash flows – we estimate the discounted future
cash flows for periods of five to ten years, depending on the cash
generating unit and valuation method for determining the
recoverable amount, and a terminal value. The future cash flows are
based on our estimates and expected future operating results,
economic conditions and a general outlook for the cash generating
unit’s industry. Our discount rates consider market rates of return,
debt to equity ratios and certain risk premiums, among other things.
The terminal value is the value attributed to the cash generating
unit’s operations beyond the projected time period of the cash flows
using a perpetuity rate based on expected economic conditions and a
general outlook for the industry.
•Using a market approach – we estimate the recoverable amount of
the cash generating unit using multiples of operating performance of
comparable entities and precedent transactions in that industry.
We have made certain assumptions for the discount and terminal
growth rates to reflect variations in expected future cash flows. These
assumptions may differ or change quickly depending on economic
conditions or other events. It is therefore possible that future changes in
assumptions may negatively affect future valuations of cash generating
units and goodwill, which could result in impairment losses.
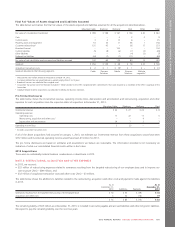
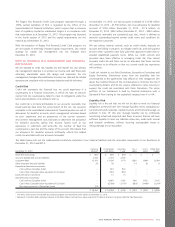
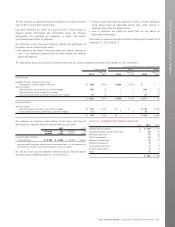
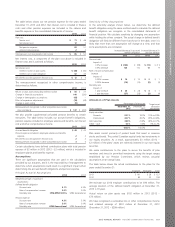
The table below is an overview of the methods and assumptions we used to determine recoverable amounts for cash generating units with
goodwill or indefinite life intangible assets that we consider significant.
Carrying value of
goodwill
Carrying value of
spectrum
licences
Recoverable
method
Periods used
(years)
Terminal
growth rates
%
Pre-tax
discount rates
%
Wireless $ 1,146 $ 2,275 Value in use 5 0.5 8.3
Cable 1,256 – Value in use 5 1.0 9.2
Impairment Losses
We did not record an impairment charge in 2013 since the recoverable
amounts of the cash generating units exceeded their carrying values.
In 2012, we recorded a total impairment charge of $80 million for
various cash generating units in the Media segment:
• $67 million in goodwill,
• $8 million in broadcast licences, and
• $5 million in program rights.
The recoverable amounts of these cash generating units were lower in
2012 than 2011 mainly due to the decline in advertising revenue in
certain markets.
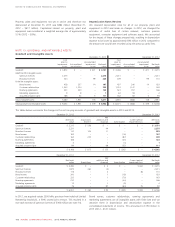
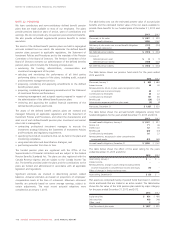
NOTE 14: INVESTMENTS
2013 2012
Publicly traded companies $ 809 $ 624
Private companies 103 231
Available-for-sale investments 912 855
Investments in joint arrangements and associates 575 629
$ 1,487 $ 1,484
Publicly Traded Companies
We hold interests in a number of publicly traded companies. This year
we recorded unrealized gains of $186 million (2012 – $225 million of
unrealized losses) with a corresponding increase in other comprehensive
income.
2013 ANNUAL REPORT ROGERS COMMUNICATIONS INC. 109