Rogers 2013 Annual Report Download - page 83
Download and view the complete annual report
Please find page 83 of the 2013 Rogers annual report below. You can navigate through the pages in the report by either clicking on the pages listed below, or by using the keyword search tool below to find specific information within the annual report.-
 1
1 -
2
-
3
-
4
-
5
-
6
-
7
-
8
-
9
-
10
-
11
-
12
-
13
-
14
-
15
-
16
-
17
-
18
-
19
-
20
-
21
-
22
-
23
-
24
-
25
-
26
-
27
-
28
-
29
-
30
-
31
-
32
-
33
-
34
-
35
-
36
-
37
-
38
-
39
-
40
-
41
-
42
-
43
-
44
-
45
-
46
-
47
-
48
-
49
-
50
-
51
-
52
-
53
-
54
-
55
-
56
-
57
-
58
-
59
-
60
-
61
-
62
-
63
-
64
-
65
-
66
-
67
-
68
-
69
-
70
-
71
-
72
-
 73
73 -
 74
74 -
 75
75 -
 76
76 -
 77
77 -
 78
78 -
 79
79 -
 80
80 -
 81
81 -
 82
82 -
 83
83 -
 84
84 -
 85
85 -
 86
86 -
 87
87 -
 88
88 -
 89
89 -
 90
90 -
 91
91 -
 92
92 -
 93
93 -
94
-
95
-
96
-
97
-
98
-
99
-
100
-
101
-
102
-
103
-
104
-
105
-
106
-
107
-
108
-
109
-
110
-
111
-
112
-
113
-
114
-
115
-
116
-
117
-
118
-
119
-
120
-
121
-
122
-
123
-
124
-
125
-
126
-
127
-
128
-
129
-
130
-
131
-
132
 |
 |

MANAGEMENT’S DISCUSSION AND ANALYSIS
MANAGEMENT’S REPORT ON INTERNAL CONTROL OVER
FINANCIAL REPORTING
Management is responsible for establishing and maintaining adequate
internal controls over financial reporting.
Our internal control system is designed to give management and the
Board reasonable assurance that our financial statements are prepared
and fairly presented in accordance with Generally Accepted Accounting
Principles. The system assures all transactions are authorized by
management, assets are safeguarded and financial records are reliable.
Management also takes steps to assure the flow of information and
communication is effective, and monitors performance and our internal
control procedures.
Management assessed the effectiveness of our internal controls over
financial reporting as of December 31, 2013, based on the criteria set
out in the Internal Control – Integrated Framework (1992) issued by the
Committee of Sponsoring Organizations of the Treadway Commission
(COSO), and concluded that it was effective at that date. Our
independent auditor, KPMG LLP, issued an audit report stating that, as
of December 31, 2013, we had effective internal controls over financial
reporting in all material respects, based on the same criteria.
All internal control systems, however, no matter how well designed,
have inherent limitations, and even systems that have been determined
to be effective can only provide reasonable assurance about the
preparation and presentation of financial statements.
CHANGES IN INTERNAL CONTROL OVER FINANCIAL
REPORTING AND DISCLOSURE CONTROLS AND
PROCEDURES
There were no changes in 2013 that materially affected, or are
reasonably likely to materially affect, our internal controls over financial
reporting.
Other Information
ACCOUNTING POLICIES
Critical Accounting Estimates
Management makes judgments, estimates and assumptions that affect
how accounting policies are applied and the amounts we report in
assets, liabilities, revenue and expenses and our related disclosure about
contingent assets and liabilities. Significant changes in our assumptions,
including those related to our future business plans and cash flows,
could cause our actual results to be materially different.
These estimates are critical to our business operations and
understanding our results of operations. We may need to use additional
judgment because of the sensitivity of the methods and assumptions
used in determining the asset, liability, revenue and expense amounts.
Fair Value
We use considerable judgment to estimate the fair value of tangible
and intangible assets acquired and liabilities assumed in an acquisition,
using the best available information including information from
financial markets. This may include discounted cash flow analyses which
utilize key assumptions such as discount rates, attrition rates, and
terminal growth rates to estimate future earnings. Actual results may
differ from these estimates.
Useful Lives
We depreciate the cost of property, plant and equipment over their
estimated useful lives by considering industry trends and company-
specific factors, including changing technologies and expectations for
the in-service period of certain assets at the time. We reassess our
estimates of useful lives annually or when circumstances change to
ensure they match the anticipated life of the technology from a
revenue-producing perspective. If technological change happens more
quickly, or in a different way than anticipated, we might have to reduce
the estimated life of property, plant and equipment, which could result
in a higher depreciation expense in future periods or an impairment
charge to write down the value. We will change our depreciation
methods, depreciation rates or asset useful lives if they are different
from our previous estimates. We recognize the effect of these changes
in net income prospectively.
Our intangible assets have increased mainly because of acquisitions. We
amortize the cost of intangible assets with finite lives over their
estimated useful lives. We use judgment to determine the life of these
assets, analyzing all relevant factors, including the expected usage of
the asset, the typical life cycle of the asset and anticipated changes in
the market demand for the products and services that the asset helps
generate.
We do not amortize intangible assets with indefinite lives (spectrum and
broadcast licences) because there is no foreseeable limit to the period
that these assets are expected to generate net cash inflows for us. After
review of the competitive, legal, regulatory and other factors, it is our
view that these factors do not limit the useful lives of our spectrum and
broadcast licences.
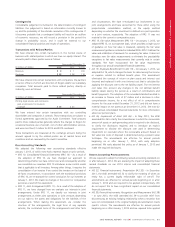
The table below shows the impact that changing the useful lives of the
finite-lived intangible assets by one year would have on annual net
income:
(In millions of dollars)
Amortization
Period
Increase in
Net Income if Life
Increased by 1 year
Decrease in
Net Income if Life
Decreased by 1 year
Brand Names 5 – 20 years $ 1 $ (1)
Customer Relationships 3 – 10 years $ 19 $ (31)
Roaming Agreements 12 years $ 3 $ (4)
Marketing Agreements 3 years $ 1 $ (2)
We will change our depreciation methods, depreciation rates or asset
useful lives if they are determined to be different from our previous
estimates. We recognize the effect of these changes in net income
prospectively.
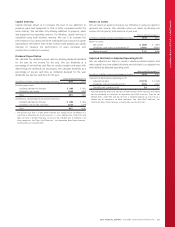
Capitalizing Direct Labour, Overhead and Interest
Certain direct labour and indirect costs associated with the acquisition,
construction, development or improvements of our networks are
capitalized to property, plant and equipment. The capitalized amounts
are calculated based on estimated costs of projects that are capital in
nature, and are generally based on a rate per hour. In addition, interest
costs are capitalized during development and construction of certain
property, plant and equipment. Capitalized amounts increase the cost of
the asset and result in a higher depreciation expense in future periods.
Impairment of Assets
Indefinite-lived intangible assets (including goodwill and spectrum and/
or broadcast licences) and definite life assets (including property, plant
and equipment and other intangible assets) are assessed for impairment
2013 ANNUAL REPORT ROGERS COMMUNICATIONS INC. 79