Rogers 2013 Annual Report Download - page 54
Download and view the complete annual report
Please find page 54 of the 2013 Rogers annual report below. You can navigate through the pages in the report by either clicking on the pages listed below, or by using the keyword search tool below to find specific information within the annual report.-
 1
1 -
2
-
3
-
4
-
5
-
6
-
7
-
8
-
9
-
10
-
11
-
12
-
13
-
14
-
15
-
16
-
17
-
18
-
19
-
20
-
21
-
22
-
23
-
24
-
25
-
26
-
27
-
28
-
29
-
30
-
31
-
32
-
33
-
34
-
35
-
36
-
37
-
38
-
39
-
40
-
41
-
42
-
43
-
 44
44 -
 45
45 -
 46
46 -
 47
47 -
 48
48 -
 49
49 -
 50
50 -
 51
51 -
 52
52 -
 53
53 -
 54
54 -
 55
55 -
 56
56 -
 57
57 -
 58
58 -
 59
59 -
 60
60 -
 61
61 -
 62
62 -
 63
63 -
 64
64 -
65
-
66
-
67
-
68
-
69
-
70
-
71
-
72
-
73
-
74
-
75
-
76
-
77
-
78
-
79
-
80
-
81
-
82
-
83
-
84
-
85
-
86
-
87
-
88
-
89
-
90
-
91
-
92
-
93
-
94
-
95
-
96
-
97
-
98
-
99
-
100
-
101
-
102
-
103
-
104
-
105
-
106
-
107
-
108
-
109
-
110
-
111
-
112
-
113
-
114
-
115
-
116
-
117
-
118
-
119
-
120
-
121
-
122
-
123
-
124
-
125
-
126
-
127
-
128
-
129
-
130
-
131
-
132
 |
 |

MANAGEMENT’S DISCUSSION AND ANALYSIS
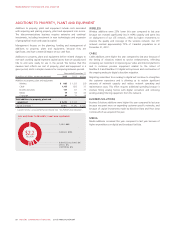
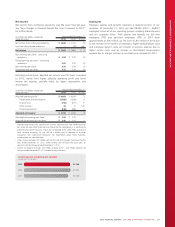
ADDITIONS TO PROPERTY, PLANT AND EQUIPMENT
Additions to property, plant and equipment include costs associated
with acquiring and placing property, plant and equipment into service.
The telecommunications business requires extensive and continual
investments, including investment in new technologies and expansion
of geographical reach and capacity capital.
Management focuses on the planning, funding and management of
additions to property, plant and equipment, because they are
significant, and have a material impact on our cash flow.
Additions to property, plant and equipment before related changes to
non-cash working capital represent capital assets that we actually took
title to and were ready for use in the period. We believe that this
measure best reflects our cost of property, plant and equipment in a
given period, and is a simpler measure for comparing between periods.
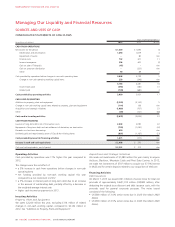
Year ended December 31
(In millions of dollars, except percentages) 2013 2012 %Chg
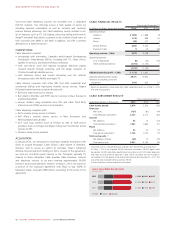
Additions to property, plant and equipment
Wireless $ 865 $ 1,123 (23)
Cable 1,105 832 33
Business Solutions 107 61 75
Media 79 55 44
Corporate 84 71 18
Total additions to property, plant and
equipment $ 2,240 $ 2,142 5
Capital intensity 117.6%17.2%0.4 pts
1Capital intensity is a key performance indicator. See “Key Performance Indicators”.
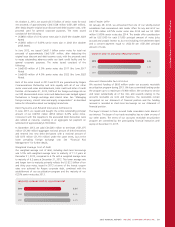
$2.2
BILLION
(%)
2013 ADDITIONS TO PROPERTY, PLANT AND EQUIPMENT
CABLE 49%
WIRELESS 39%
MEDIA 4%
CORPORATE 3%
BUSINESS SOLUTIONS 5%
WIRELESS
Wireless additions were 23%lower this year compared to last year
because we invested significantly less in HSPA capacity and spent less
on deployment of our LTE network, offset by higher investments to
improve the quality and coverage of the wireless network. Our LTE
network reached approximately 73%of Canada’s population as at
December 31, 2013.
CABLE
Cable additions were higher this year compared to last year because of
the timing of initiatives related to service enhancements, reflecting
increasing our investment in improving our video and Internet platforms
and in customer premise equipment related to the rollout of
NextBox 2.0 and NextBox 3.0 digital set-top boxes and continuation of
the ongoing analog to digital subscriber migration.
Migrating subscribers from analog to digital will continue to strengthen
the customer experience and is allowing us to reclaim significant
amounts of network capacity and reduce network operating and
maintenance costs. This effort requires additional spending because it
involves fitting analog homes with digital converters and removing
existing analog filtering equipment from the network.
BUSINESS SOLUTIONS
Business Solutions additions were higher this year compared to last year
because we spent more on expanding customer specific networks, and
because of capital investments made by Blackiron Data and Pivot Data
Centres which we acquired this year.
MEDIA
Media additions increased this year compared to last year because of
higher expenditures on digital and broadcast facilities.
50 ROGERS COMMUNICATIONS INC. 2013 ANNUAL REPORT