Rogers 2013 Annual Report Download - page 56
Download and view the complete annual report
Please find page 56 of the 2013 Rogers annual report below. You can navigate through the pages in the report by either clicking on the pages listed below, or by using the keyword search tool below to find specific information within the annual report.-
 1
1 -
2
-
3
-
4
-
5
-
6
-
7
-
8
-
9
-
10
-
11
-
12
-
13
-
14
-
15
-
16
-
17
-
18
-
19
-
20
-
21
-
22
-
23
-
24
-
25
-
26
-
27
-
28
-
29
-
30
-
31
-
32
-
33
-
34
-
35
-
36
-
37
-
38
-
39
-
40
-
41
-
42
-
43
-
44
-
45
-
 46
46 -
 47
47 -
 48
48 -
 49
49 -
 50
50 -
 51
51 -
 52
52 -
 53
53 -
 54
54 -
 55
55 -
 56
56 -
 57
57 -
 58
58 -
 59
59 -
 60
60 -
 61
61 -
 62
62 -
 63
63 -
 64
64 -
 65
65 -
 66
66 -
67
-
68
-
69
-
70
-
71
-
72
-
73
-
74
-
75
-
76
-
77
-
78
-
79
-
80
-
81
-
82
-
83
-
84
-
85
-
86
-
87
-
88
-
89
-
90
-
91
-
92
-
93
-
94
-
95
-
96
-
97
-
98
-
99
-
100
-
101
-
102
-
103
-
104
-
105
-
106
-
107
-
108
-
109
-
110
-
111
-
112
-
113
-
114
-
115
-
116
-
117
-
118
-
119
-
120
-
121
-
122
-
123
-
124
-
125
-
126
-
127
-
128
-
129
-
130
-
131
-
132
 |
 |

MANAGEMENT’S DISCUSSION AND ANALYSIS
We used a combination of value-in-use and fair-value-less-costs-to-sell
methodologies with pre-tax discount rates of approximately 10%in
arriving at the impairment amount in 2012. The recoverable amounts of
the cash generating units declined in 2012 mainly because advertising
revenue was lower in certain markets.
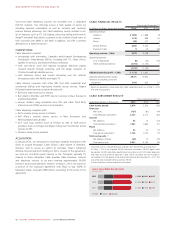
Finance Costs
Years ended December 31
(In millions of dollars) 2013 2012 %Chg
Interest on long-term debt $ 734 $ 691 6
Interest on pension liability 14 7 100
Foreign exchange (gain) loss 23 (9) n/m
Change in fair value of derivative
instruments (16) 1 n/m
Capitalized interest (25) (28) (11)
Other 12 933
Total finance costs $ 742 $ 671 11
Interest on long-term debt was higher in 2013, the net effect of an
increase in the amount of outstanding debt, partially offset by a decrease
in the weighted average interest rate on our outstanding debt, mainly
related to refinancing activities completed in 2013. See “Managing Our
Liquidity and Financial Resources” for more information.
In 2013, the foreign exchange loss of $23 million primarily relates to
the depreciation in the Canadian dollar relative to the US dollar and its
impact on our US$350 million of senior notes due 2038, which was not
hedged for accounting purposes prior to March 6, 2013. Most of the
foreign exchange loss was offset by the change in the fair value of the
associated Debt Derivatives as discussed below. We use cross currency
interest rate exchange agreements (Debt Derivatives) to hedge the
foreign exchange risk on all of our US$ denominated senior notes and
debentures.
The non-cash gain on the fair value of derivative instruments in 2013
was primarily from the change in fair value of the Debt Derivatives prior
to March 6, 2013. Subsequently, all Debt Derivatives were designated
as hedges for accounting purposes.
Other Income
Other income was lower this year, largely due to a $233 million gain
recorded in 2012 related to the sale of spectrum licenses by Inukshuk, a
50%owned joint venture, to the other non-related venture.
Other income of $81 million this year mainly reflects a $47 million gain
from the sale of TVtropolis and certain other investment income.
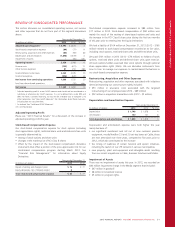
Income Taxes
Our effective income tax rate was 26.3%for 2013 and 26.4%for
2012.
The 2013 and 2012 effective income tax rates were consistent with the
statutory income tax rates. For both years, this is the net effect of
several offsetting adjustments to our income tax expense. The most
significant adjustments were:
• realizing capital gains (of which only 50%are taxable)
• recognizing and using losses and other tax attributes that were not
previously recognized
• offset by a tax charge relating to the revaluation of our net deferred
tax liability to reflect an increase in tax rates and non-deductible
stock-based compensation.
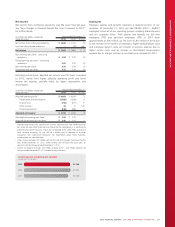
We paid $116 million more in cash income taxes in 2013 than in 2012,
mainly because we used substantially all of our remaining non-capital
income tax loss carryforwards in 2012. In 2011, legislative changes
eliminated the deferral of partnership income, accelerating the payment
of approximately $700 million of previously deferred cash taxes over a
five year amortization period, beginning in 2012 at 15%,20%in each
of 2013 through 2015, and 25%in 2016. Our cash tax payments for
the 2014 to 2016 taxation years will include these additional amounts.
While the elimination of the partnership deferral affects the timing of
cash tax payments, it does not impact our income tax expense for
accounting purposes.
The table below shows the difference between income tax expense
from continuing operations, and income tax expense computed by
applying the statutory income tax rate to income before income taxes:
Years ended December 31
(In millions of dollars, except tax rate) 2013 2012
Statutory income tax rate 26.5%26.4%
Income before income taxes $ 2,265 $ 2,345
Computed income tax expense using statutory
income tax rate 600 619
Revaluation of deferred tax balances due to legislative
changes 854
Non-taxable portion of capital gains (9) (61)
Recognition of previously unrecognized deferred tax
assets (14) (22)
Impairment of goodwill and intangible assets –11
Non-deductible stock-based compensation 89
Other items 310
Income tax expense $ 596 $ 620
Effective income tax rate 26.3%26.4%
Cash income taxes paid $ 496 $ 380
Discontinued Operations
As discussed in the Cable segment, the second quarter of 2012 was the
last period of operations for our Video business, from which point the
associated results were treated as discontinued operations for
accounting and reporting purposes.
52 ROGERS COMMUNICATIONS INC. 2013 ANNUAL REPORT