Rogers 2013 Annual Report Download - page 40
Download and view the complete annual report
Please find page 40 of the 2013 Rogers annual report below. You can navigate through the pages in the report by either clicking on the pages listed below, or by using the keyword search tool below to find specific information within the annual report.-
 1
1 -
2
-
3
-
4
-
5
-
6
-
7
-
8
-
9
-
10
-
11
-
12
-
13
-
14
-
15
-
16
-
17
-
18
-
19
-
20
-
21
-
22
-
23
-
24
-
25
-
26
-
27
-
28
-
29
-
 30
30 -
 31
31 -
 32
32 -
 33
33 -
 34
34 -
 35
35 -
 36
36 -
 37
37 -
 38
38 -
 39
39 -
 40
40 -
 41
41 -
 42
42 -
 43
43 -
 44
44 -
 45
45 -
 46
46 -
 47
47 -
 48
48 -
 49
49 -
 50
50 -
51
-
52
-
53
-
54
-
55
-
56
-
57
-
58
-
59
-
60
-
61
-
62
-
63
-
64
-
65
-
66
-
67
-
68
-
69
-
70
-
71
-
72
-
73
-
74
-
75
-
76
-
77
-
78
-
79
-
80
-
81
-
82
-
83
-
84
-
85
-
86
-
87
-
88
-
89
-
90
-
91
-
92
-
93
-
94
-
95
-
96
-
97
-
98
-
99
-
100
-
101
-
102
-
103
-
104
-
105
-
106
-
107
-
108
-
109
-
110
-
111
-
112
-
113
-
114
-
115
-
116
-
117
-
118
-
119
-
120
-
121
-
122
-
123
-
124
-
125
-
126
-
127
-
128
-
129
-
130
-
131
-
132
 |
 |

MANAGEMENT’S DISCUSSION AND ANALYSIS
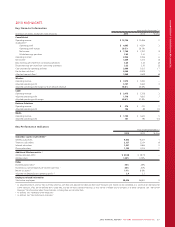
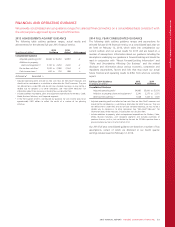
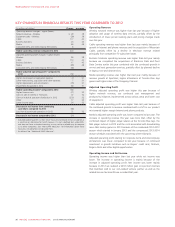
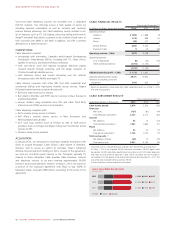
KEY CHANGES IN FINANCIAL RESULTS THIS YEAR COMPARED TO 2012
(In millions of dollars) Change see page
Operating revenue changes – higher (lower):
Network revenue – Wireless $ 29 39
Equipment sales – Wireless (39) 39
Cable 117 42
Business Solutions 23 45
Media 84 48
Corporate items and intercompany eliminations 6
Higher operating revenue compared to 2012 220
Adjusted operating profit changes – higher (lower):
Wireless 94 39
Cable 113 42
Business Solutions 17 45
Media (29) 48
Corporate items and intercompany eliminations (36)
Higher adjusted operating profit 1compared to
2012 159
Higher stock-based compensation expense (7) 51
Lower restructuring, acquisition and other expenses 7 51
Higher depreciation and amortization (79) 51
Impairment recognized in 2012 80 51
Higher operating income 2compared to 2012 160
Higher finance costs (71) 52
Gain on sale of interest in TVtropolis 47 52
Gain on Inukshuk spectrum distribution in 2012 (233) 52
Other 17 53
Lower income taxes 24 52
Decrease in net income from continuing
operations compared to 2012 (56)
Loss from discontinued operations in 2012 32 52
Decrease in net income compared to 2012 (24)
1Adjusted operating profit is a Non-GAAP measure and should not be considered as
a substitute or alternative for GAAP measure. It is not a defined term under IFRS,
and does not have a standard meaning, so may not be a reliable way to compare
us to other companies. See “Non-GAAP Measures” for information about these
measures, including how we calculate them.
2As defined. See “Additional GAAP Measures”.
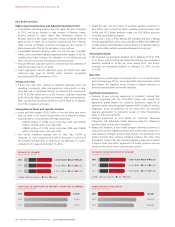
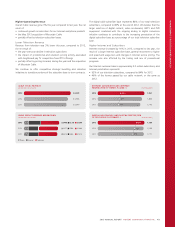
Operating Revenue
Wireless network revenue was higher than last year because of higher
adoption and usage of wireless data services, partially offset by the
introduction of lower priced roaming plans and pricing changes made
over this year.
Cable operating revenue was higher than last year mainly because of
growth in Internet and phone revenues and the acquisition of Mountain
Cable, partially offset by a decline in television revenue related
principally from competitive TV subscriber losses.
Business Solutions operating revenue was higher than last year mainly
because we completed the acquisitions of Blackiron Data and Pivot
Data Centres earlier this year combined with the continued growth in
on-net and next generation services, partially offset by planned decline
in legacy voice and data services.
Media operating revenue was higher than last year mainly because of
revenue growth at Sportsnet, higher attendance at Toronto Blue Jays
games and higher sales at The Shopping Channel.
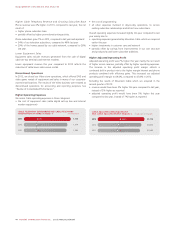
Adjusted Operating Profit
Wireless adjusted operating profit was higher this year because of
higher network revenue, our continued cost management and
productivity initiatives implemented across various areas and lower cost
of equipment.
Cable adjusted operating profit was higher than last year because of
the continued growth in revenue combined with a shift in our product
mix towards higher margin Internet and phone products.
Media’s adjusted operating profit was lower compared to last year. The
increase in operating revenue this year was more than offset by the
combined impact of higher player salaries at the Toronto Blue Jays, the
NHL player lockout in 2012 and the costs associated with broadcasting
more NHL hockey games in 2013 because of the condensed 2012-2013
season which started in January 2013 and the compressed 2013-2014
season schedule associated with the upcoming winter Olympics.
Adjusted operating profit relating to Corporate items and intercompany
eliminations was lower compared to last year because of continued
investment in growth initiatives such as Rogers’ credit card, Outrank,
Rogers Alerts and other digital opportunities.
Operating Income and Net Income
Operating income was higher than last year while net income was
lower. The increase in operating income is mainly because of the
increase in adjusted operating profit. Net income was lower mainly
because in 2012 we realized a $233 million gain on spectrum licenses
that Inukshuk sold to our non-related venture partner as well as the
related income tax benefits we recorded that year.
36 ROGERS COMMUNICATIONS INC. 2013 ANNUAL REPORT