Rogers 2013 Annual Report Download - page 111
Download and view the complete annual report
Please find page 111 of the 2013 Rogers annual report below. You can navigate through the pages in the report by either clicking on the pages listed below, or by using the keyword search tool below to find specific information within the annual report.-
 1
1 -
2
-
3
-
4
-
5
-
6
-
7
-
8
-
9
-
10
-
11
-
12
-
13
-
14
-
15
-
16
-
17
-
18
-
19
-
20
-
21
-
22
-
23
-
24
-
25
-
26
-
27
-
28
-
29
-
30
-
31
-
32
-
33
-
34
-
35
-
36
-
37
-
38
-
39
-
40
-
41
-
42
-
43
-
44
-
45
-
46
-
47
-
48
-
49
-
50
-
51
-
52
-
53
-
54
-
55
-
56
-
57
-
58
-
59
-
60
-
61
-
62
-
63
-
64
-
65
-
66
-
67
-
68
-
69
-
70
-
71
-
72
-
73
-
74
-
75
-
76
-
77
-
78
-
79
-
80
-
81
-
82
-
83
-
84
-
85
-
86
-
87
-
88
-
89
-
90
-
91
-
92
-
93
-
94
-
95
-
96
-
97
-
98
-
99
-
100
-
 101
101 -
 102
102 -
 103
103 -
 104
104 -
 105
105 -
 106
106 -
 107
107 -
 108
108 -
 109
109 -
 110
110 -
 111
111 -
 112
112 -
 113
113 -
 114
114 -
 115
115 -
 116
116 -
 117
117 -
 118
118 -
 119
119 -
 120
120 -
 121
121 -
122
-
123
-
124
-
125
-
126
-
127
-
128
-
129
-
130
-
131
-
132
 |
 |

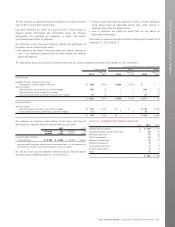
NOTES TO CONSOLIDATED FINANCIAL STATEMENTS
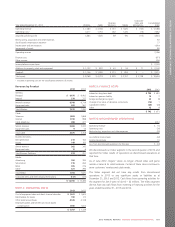
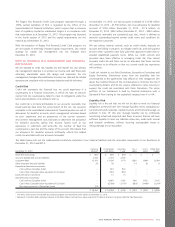
NOTE 10: EARNINGS PER SHARE
The table below shows the calculation of basic and diluted earnings per
share for 2013 and 2012.
2013 2012
Numerator:
Net income for the year from continuing operations $ 1,669 $ 1,725
Loss from discontinued operations –(32)
Net income for the year $ 1,669 $ 1,693
Denominator (in millions):
Weighted average number of shares outstanding – basic 515 519
Effect of dilutive securities:
Employee stock options 33
Weighted average number of shares outstanding – diluted 518 522
2013 2012
Earnings per share – basic:
Earnings per share from continuing operations $3.24 $ 3.32
Loss per share from discontinued operations –(0.06)
Earnings per share – basic $3.24 $ 3.26
Earnings per share – diluted:
Earnings per share from continuing operations $3.22 $ 3.30
Loss per share from discontinued operations –(0.06)
Earnings per share – diluted $3.22 $ 3.24
A total of 577,584 options were out of the money for 2013 (2012 –
17,240). They were excluded from the calculation since they were anti-
dilutive.
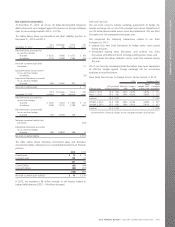
NOTE 11: OTHER CURRENT ASSETS
2013 2012
Inventories $ 276 $ 293
Prepaid expenses 136 126
Income tax receivable 24 39
Other 26
$ 438 $ 464
Cost of equipment sales and merchandise for resale includes $1,667
million (2012 – $1,707 million) of inventory costs.
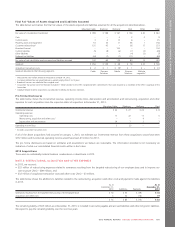
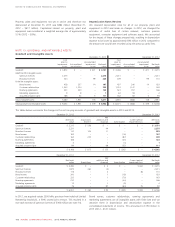
NOTE 12: PROPERTY, PLANT AND EQUIPMENT
The table below shows property, plant and equipment and accumulated depreciation as at December 31, 2013 and 2012.
December 31, 2013 December 31, 2012
Cost
Accumulated
depreciation
Net book
value Cost
Accumulated
depreciation
Net book
value
Land and buildings $ 923 $ 291 $ 632 $ 894 $ 260 $ 634
Cable and wireless network 18,197 11,287 6,910 16,805 10,138 6,667
Computer equipment and software 4,553 3,031 1,522 3,972 2,644 1,328
Customer premise equipment 2,009 1,415 594 1,764 1,319 445
Leasehold improvements 492 271 221 407 248 159
Equipment and vehicles 1,124 748 376 1,055 712 343
$ 27,298 $ 17,043 $ 10,255 $ 24,897 $ 15,321 $ 9,576
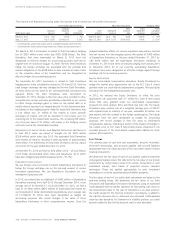
The tables below summarize the changes in the net carrying amounts of property, plant and equipment during 2013 and 2012.
December 31, 2012 December 31, 2013
Net book
value Additions
Acquisitions
(note 7) Depreciation Other
Net book
value
Land and buildings $ 634 $ 25 $ 3 $ (30) $ – $ 632
Cable and wireless network 6,667 1,235 91 (1,087) 4 6,910
Computer equipment and software 1,328 495 6 (310) 3 1,522
Customer premise equipment 445 372 6 (230) 1 594
Leasehold improvements 159 27 44 (20) 11 221
Equipment and vehicles 343 86 8 (71) 10 376
$ 9,576 $ 2,240 $ 158 $ (1,748) $ 29 $ 10,255
December 31, 2011 December 31, 2012
Net book
value Additions Acquisitions Depreciation Other
Net book
value
Land and buildings $ 635 $ 30 $ – $ (29) $ (2) $ 634
Cable and wireless network 6,401 1,354 – (1,090) 2 6,667
Computer equipment and software 1,216 407 – (293) (2) 1,328
Customer premise equipment 364 255 – (175) 1 445
Leasehold improvements 153 27 – (21) – 159
Equipment and vehicles 345 69 – (70) (1) 343
$ 9,114 $ 2,142 $ – $ (1,678) $ (2) $ 9,576
2013 ANNUAL REPORT ROGERS COMMUNICATIONS INC. 107