Rogers 2013 Annual Report Download - page 38
Download and view the complete annual report
Please find page 38 of the 2013 Rogers annual report below. You can navigate through the pages in the report by either clicking on the pages listed below, or by using the keyword search tool below to find specific information within the annual report.-
 1
1 -
2
-
3
-
4
-
5
-
6
-
7
-
8
-
9
-
10
-
11
-
12
-
13
-
14
-
15
-
16
-
17
-
18
-
19
-
20
-
21
-
22
-
23
-
24
-
25
-
26
-
27
-
 28
28 -
 29
29 -
 30
30 -
 31
31 -
 32
32 -
 33
33 -
 34
34 -
 35
35 -
 36
36 -
 37
37 -
 38
38 -
 39
39 -
 40
40 -
 41
41 -
 42
42 -
 43
43 -
 44
44 -
 45
45 -
 46
46 -
 47
47 -
 48
48 -
49
-
50
-
51
-
52
-
53
-
54
-
55
-
56
-
57
-
58
-
59
-
60
-
61
-
62
-
63
-
64
-
65
-
66
-
67
-
68
-
69
-
70
-
71
-
72
-
73
-
74
-
75
-
76
-
77
-
78
-
79
-
80
-
81
-
82
-
83
-
84
-
85
-
86
-
87
-
88
-
89
-
90
-
91
-
92
-
93
-
94
-
95
-
96
-
97
-
98
-
99
-
100
-
101
-
102
-
103
-
104
-
105
-
106
-
107
-
108
-
109
-
110
-
111
-
112
-
113
-
114
-
115
-
116
-
117
-
118
-
119
-
120
-
121
-
122
-
123
-
124
-
125
-
126
-
127
-
128
-
129
-
130
-
131
-
132
 |
 |

MANAGEMENT’S DISCUSSION AND ANALYSIS
2013 Financial Results
Please see “Critical Accounting Estimates” and “New Accounting Standards”, in “Accounting Policies” in this MD&A, and the Notes to our 2013
Audited Consolidated Financial Statements for important accounting policies and estimates as they relate to the following discussion.
We use several key performance indicators to measure our performance against our strategies and the results of our peers and competitors. Many
of these are not defined terms under IFRS and so should not be considered as alternative measures to net income or any other financial measure of
performance under IFRS. See “Key Performance Indicators” and “Non-GAAP Measures” for more information.
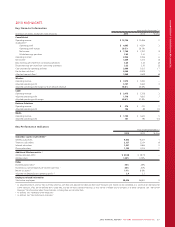
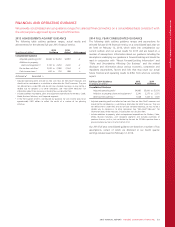
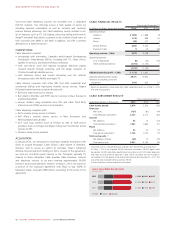
SUMMARY OF CONSOLIDATED RESULTS
Years ended December 31
(In millions of dollars, except per share amounts) 2013 2012 %Chg
Operating revenue
Wireless $ 7,270 $ 7,280 –
Cable 3,475 3,358 3
Business Solutions 374 351 7
Media 1,704 1,620 5
Corporate items and intercompany eliminations (117) (123) (5)
Operating revenue 12,706 12,486 2
Adjusted operating profit
Wireless 3,157 3,063 3
Cable 1,718 1,605 7
Business Solutions 106 89 19
Media 161 190 (15)
Corporate items and intercompany eliminations (149) (113) 32
Adjusted operating profit 1$ 4,993 $ 4,834 3
Adjusted operating profit margin 39.3%38.7%
Operating income 22,926 2,766 6
Net income from continuing operations 1,669 1,725 (3)
Diluted earnings per share – continuing operations 3.22 3.30 (2)
Net income 1,669 1,693 (1)
Diluted earnings per share 3.22 3.24 (1)
Adjusted net income 11,769 1,781 (1)
Adjusted diluted earnings per share 13.42 3.41 –
Additions to property, plant and equipment $ 2,240 $ 2,142 5
Pre-tax free cash flow 12,044 2,029 1
After-tax free cash flow 11,548 1,649 (6)
Cash provided by operating activities 3,990 3,421 17
1Adjusted operating profit, adjusted net income, adjusted diluted earnings per share, pre-tax free cash flow and after-tax free cash flow are non-GAAP measures and should not be
considered as a substitute or alternative for GAAP measures. These are not defined terms under IFRS and do not have standard meanings, so may not be a reliable way to compare
us to other companies. See “Non-GAAP Measures” for information about these measures, including how we calculate them.
2As defined. See “Additional GAAP Measures”.
34 ROGERS COMMUNICATIONS INC. 2013 ANNUAL REPORT