Rogers 2013 Annual Report Download - page 53
Download and view the complete annual report
Please find page 53 of the 2013 Rogers annual report below. You can navigate through the pages in the report by either clicking on the pages listed below, or by using the keyword search tool below to find specific information within the annual report.-
 1
1 -
2
-
3
-
4
-
5
-
6
-
7
-
8
-
9
-
10
-
11
-
12
-
13
-
14
-
15
-
16
-
17
-
18
-
19
-
20
-
21
-
22
-
23
-
24
-
25
-
26
-
27
-
28
-
29
-
30
-
31
-
32
-
33
-
34
-
35
-
36
-
37
-
38
-
39
-
40
-
41
-
42
-
 43
43 -
 44
44 -
 45
45 -
 46
46 -
 47
47 -
 48
48 -
 49
49 -
 50
50 -
 51
51 -
 52
52 -
 53
53 -
 54
54 -
 55
55 -
 56
56 -
 57
57 -
 58
58 -
 59
59 -
 60
60 -
 61
61 -
 62
62 -
 63
63 -
64
-
65
-
66
-
67
-
68
-
69
-
70
-
71
-
72
-
73
-
74
-
75
-
76
-
77
-
78
-
79
-
80
-
81
-
82
-
83
-
84
-
85
-
86
-
87
-
88
-
89
-
90
-
91
-
92
-
93
-
94
-
95
-
96
-
97
-
98
-
99
-
100
-
101
-
102
-
103
-
104
-
105
-
106
-
107
-
108
-
109
-
110
-
111
-
112
-
113
-
114
-
115
-
116
-
117
-
118
-
119
-
120
-
121
-
122
-
123
-
124
-
125
-
126
-
127
-
128
-
129
-
130
-
131
-
132
 |
 |

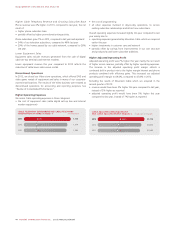
MANAGEMENT’S DISCUSSION AND ANALYSIS
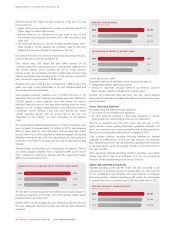
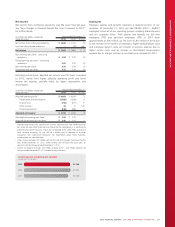
Higher Operating Expenses
We assess Media operating expenses in four areas:
• the cost of broadcast content (including sports programming)
• the cost of retail products sold by The Shopping Channel and Sports
Entertainment
• Blue Jays player payroll
• all other expenses involved in day-to-day operations.
Operating expenses were 8%higher than 2012, mainly because of
higher programming costs at Sportsnet, higher Toronto Blue Jays player
salaries, higher merchandise spending at The Shopping Channel and
costs associated with our launch of Next Issue Canada.
The higher programming costs this year are a combination of lower
costs in 2012 because of the NHL player lockout, and higher costs this
year because more hockey games than normal were aired because of
the compressed NHL hockey schedule due in part to upcoming winter
Olympics. Approximately $62 million of Media’s year over year increase
in operating expense this year resulted from the 2012 NHL lockout and
the timing of games aired in 2013. Player salaries at the Toronto Blue
Jays were $34 million higher this year.
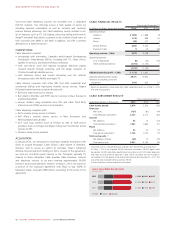
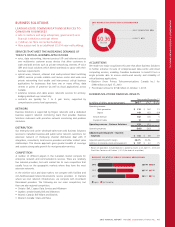
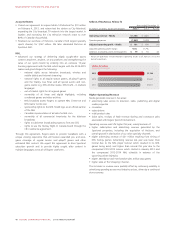
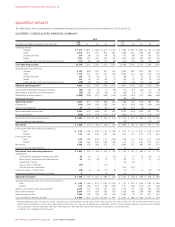
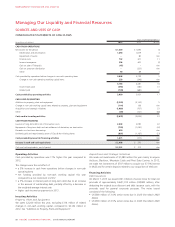
(IN MILLIONS OF DOLLARS)
MEDIA ADJUSTED OPERATING PROFIT
2013
2012
2011
$161
$190
$180
Lower Adjusted Operating Profit
Adjusted operating profit was down compared to last year mainly
because of revenue and expenses changes described above.
Excluding the impact of the 2012 NHL lockout and the compressed NHL
schedule:
• operating revenue would have been 4%higher this year compared
to last year, instead of 5%higher as reported
• adjusted operating profit would have been 7%higher this year
compared to last year, instead of 15%lower as reported.
Excluding the acquisition of theScore:
• operating revenue would have been 4%higher this year compared
to last year, instead of 5%higher as reported
• adjusted operating profit would have been 19%lower this year
compared to last year, instead of 15%lower as reported.
2013 ANNUAL REPORT ROGERS COMMUNICATIONS INC. 49