PNC Bank 2002 Annual Report Download - page 97
Download and view the complete annual report
Please find page 97 of the 2002 PNC Bank annual report below. You can navigate through the pages in the report by either clicking on the pages listed below, or by using the keyword search tool below to find specific information within the annual report.-
 1
1 -
2
-
3
-
4
-
5
-
6
-
7
-
8
-
9
-
10
-
11
-
12
-
13
-
14
-
15
-
16
-
17
-
18
-
19
-
20
-
21
-
22
-
23
-
24
-
25
-
26
-
27
-
28
-
29
-
30
-
31
-
32
-
33
-
34
-
35
-
36
-
37
-
38
-
39
-
40
-
41
-
42
-
43
-
44
-
45
-
46
-
47
-
48
-
49
-
50
-
51
-
52
-
53
-
54
-
55
-
56
-
57
-
58
-
59
-
60
-
61
-
62
-
63
-
64
-
65
-
66
-
67
-
68
-
69
-
70
-
71
-
72
-
73
-
74
-
75
-
76
-
77
-
78
-
79
-
80
-
81
-
82
-
83
-
84
-
85
-
86
-
 87
87 -
 88
88 -
 89
89 -
 90
90 -
 91
91 -
 92
92 -
 93
93 -
 94
94 -
 95
95 -
 96
96 -
 97
97 -
 98
98 -
 99
99 -
 100
100 -
 101
101 -
 102
102 -
 103
103 -
 104
104 -
 105
105 -
 106
106 -
 107
107 -
108
-
109
-
110
-
111
-
112
-
113
-
114
-
115
-
116
-
117
 |
 |

95
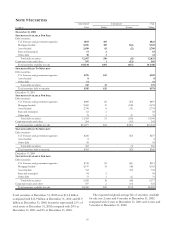
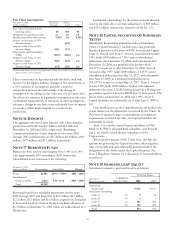
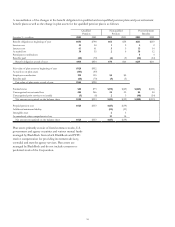
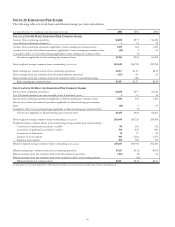
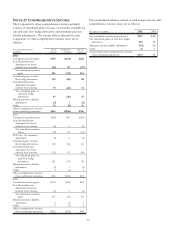
The components of net periodic pension and post-retirement benefit cost were as follows:
Q
ualified Pension Plans Non
q
ualified Pension Plans Post-retirement Benefits
Year ended December 31 – in millions 2002 2001 2000 2002 2001 2000 2002 2001 2000
Service cost $33 $30 $31 $1 $2 $2 $2 $2 $2
Interest cost 61 61 60 55515 14 14
Expected return on plan assets (97) (97) (93)
Transition amount amortization (5) 1
Curtailment gain (3)
Amortization of prior service cost (1) (1) (1) (6) (6) (6)
Recognized net actuarial loss 19 2 2(1)2
Losses due to settlements 7
Net
p
eriodic cost $15 $
(
7
)
$
(
8
)
$8 $9 $14 $13 $7 $10
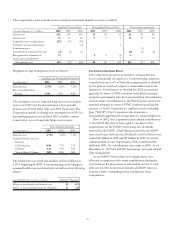
Weighted-average assumptions were as follows:
Q
ualified and Non
q
ualified Pensions
As of December 31 2002 2001 2000
Discount rate 6.75% 7.25% 7.50%
Rate of compensation
increase 4.00 4.50 4.50
The assumption for the expected long-term return on plan
assets was 9.50% for the determination of net periodic
pension cost for the 2002, 2001 and 2000 fiscal years. The
Corporation intends to change this assumption to 8.50% for
determining pension cost in fiscal 2003 to reflect a more
conservative view of long-term future trust returns.
Post-retirement Benefits
As of December 31 2002 2001 2000
Discount rate 6.75% 7.25% 7.50%
Expected health care cost
trend rate
Following year 11.00 7.75 7.75
Ultimate 5.25 5.50 5.00
Y
ear to Reach Ultimate 2009 2005 2005
The health care cost trend rate declines until it stabilizes at
5.25% beginning in 2009. A one-percentage-point change in
assumed health care cost trend rates would have the following
effects:
Year ended December 31, 2002 – in millions Increase Decrease
Effect on total service and interest cost $1 $(1)
Effect on post-retirement benefit obligation 13 (11)
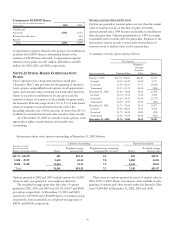
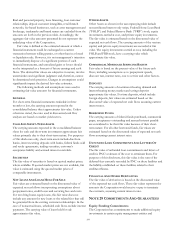
INCENTIVE SAVINGS PLAN
The Corporation sponsors an incentive savings plan that
covers substantially all employees. Under this plan, employee
contributions up to 6% of biweekly compensation as defined
by the plan are matched, subject to Internal Revenue Code
limitations. Contributions to the plan for 2002 are matched
primarily by shares of PNC common stock held in treasury,
except for participants who have exercised their diversification
election rights. Contributions to the Plan for prior years were
matched primarily by shares of PNC common stock held in
treasury, or by the Corporation’s employee stock ownership
plan (“ESOP”). The Corporation also maintains a
nonqualified supplemental savings plan for certain employees.
Prior to 2002, the Corporation made annual contributions
to the ESOP that were at least equal to the debt service
requirements on the ESOP’s borrowings less dividends
received by the ESOP. All dividends received by the ESOP
were used to pay debt service. Dividends used for debt service
totaled $8 million in 2001 and $9 million in 2000. To satisfy
additional debt service requirements, PNC contributed $1
million in 2001. No contributions were made in 2000. As of
December 31, 2001 the ESOP’s borrowings were paid off and
fully extinguished.
As the ESOP’s borrowings were repaid, shares were
allocated to employees who made contributions during the
year based on the proportion of annual debt service to total
debt service. The Corporation includes all ESOP shares as
common shares outstanding in the earnings per share
computation.