PNC Bank 2002 Annual Report Download - page 32
Download and view the complete annual report
Please find page 32 of the 2002 PNC Bank annual report below. You can navigate through the pages in the report by either clicking on the pages listed below, or by using the keyword search tool below to find specific information within the annual report.-
 1
1 -
2
-
3
-
4
-
5
-
6
-
7
-
8
-
9
-
10
-
11
-
12
-
13
-
14
-
15
-
16
-
17
-
18
-
19
-
20
-
21
-
 22
22 -
 23
23 -
 24
24 -
 25
25 -
 26
26 -
 27
27 -
 28
28 -
 29
29 -
 30
30 -
 31
31 -
 32
32 -
 33
33 -
 34
34 -
 35
35 -
 36
36 -
 37
37 -
 38
38 -
 39
39 -
 40
40 -
 41
41 -
 42
42 -
43
-
44
-
45
-
46
-
47
-
48
-
49
-
50
-
51
-
52
-
53
-
54
-
55
-
56
-
57
-
58
-
59
-
60
-
61
-
62
-
63
-
64
-
65
-
66
-
67
-
68
-
69
-
70
-
71
-
72
-
73
-
74
-
75
-
76
-
77
-
78
-
79
-
80
-
81
-
82
-
83
-
84
-
85
-
86
-
87
-
88
-
89
-
90
-
91
-
92
-
93
-
94
-
95
-
96
-
97
-
98
-
99
-
100
-
101
-
102
-
103
-
104
-
105
-
106
-
107
-
108
-
109
-
110
-
111
-
112
-
113
-
114
-
115
-
116
-
117
 |
 |

30
REVIEW OF BUSINESSES
PNC operates seven major businesses engaged in regional
community banking; wholesale banking, including corporate
banking, real estate finance and asset-based lending; wealth
management; asset management and global fund processing
services. Treasury management activities, which include cash
and investment management, receivables management,
disbursement services and global trade services; capital
markets products, which include foreign exchange, derivatives
trading and loan syndications; and equipment leasing products
are offered through Corporate Banking and sold by several
businesses across the Corporation.
Results of individual businesses are presented based on
PNC’s management accounting practices and the
Corporation’s management structure. There is no
comprehensive, authoritative body of guidance for
management accounting equivalent to generally accepted
accounting principles; therefore, the financial results of
individual businesses are not necessarily comparable with
similar information for any other company. Financial results
are presented, to the extent practicable, as if each business
operated on a stand-alone basis. Also, certain amounts for
2001 have been reclassified to conform with the 2002
presentation.
The management accounting process uses various balance
sheet and income statement assignments and transfers to
measure performance of the businesses. Methodologies are
refined from time to time as management accounting practices
are enhanced and businesses change. There were no significant
methodology changes made during 2002 other than the impact
of refinements to the Corporation’s reserve methodology
related to loans and unfunded credit facilities. Securities or
borrowings and related net interest income are assigned based
on the net asset or liability position of each business. Capital is
assigned based on management’s assessment of inherent risks
and equity levels at independent companies providing similar
products and services. The allowance for credit losses is
allocated based on management’s assessment of risk inherent
in the loan portfolios. The costs incurred by support areas not
directly aligned with the businesses are allocated primarily
based on the utilization of services.
Total business financial results differ from consolidated
results from continuing operations. This is primarily due to
differences between management accounting practices and
generally accepted accounting principles such as economic
capital assignments rather than legal entity shareholders’
equity, unit cost allocations rather than actual expense
assignments, and policies that do not fully allocate holding
company expenses; minority interest in income of
consolidated entities; eliminations and other corporate items.
The impact of these differences is reflected in the “Other”
category. Other also includes equity management activities and
residual asset and liability management activities which do not
meet the criteria for disclosure as a separate reportable
segment. Other reflected a net loss of $72 million in 2002
compared with a net loss of $190 million in 2001. The net loss
was smaller in 2002 primarily due to lower net losses from
equity management activities and a benefit from the
assignment of unassigned allowance for credit losses to the
Wholesale Banking businesses in 2002. Details of inter-
segment revenues are included in Note 26 Segment Reporting.
The operating results and financial impact of the disposition
of the residential mortgage banking business, previously PNC
Mortgage, are included in discontinued operations.
“Other Information” included in the individual business
tables that follow is presented as of period end, except for net
charge-offs, net gains (losses) on loans held for sale and
average full-time equivalent employees (FTEs).
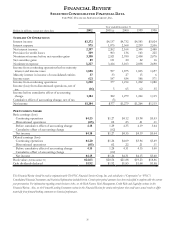
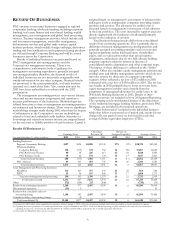
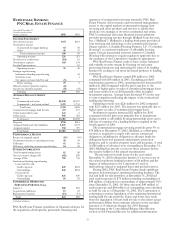
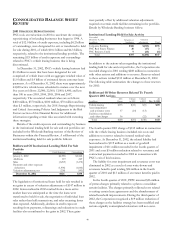
Results Of Businesses (a)
O
p
eratin
g
Return on
Earnings(Loss) Revenue (b) Assigned Capital(c) Average Assets
Year ended December 31 - dollars in millions 2002 2001 2002 2001 2002 2001 2002 2001
Banking Businesses
Regional Community Banking $697 $596 $2,098 $2,145 27% 22% $38,976 $40,285
Wholesale Banking
Corporate Banking 150 (375) 631 764 14 (30) 13,807 16,685
PNC Real Estate Finance 90 38 226 213 23 10 5,018 5,290
PNC Business Credit 40 22 193 134 16 13 3,837 2,463
Total wholesale banking 280 (315) 1,050 1,111 17 (17) 22,662 24,438
PNC Advisors 97 143 654 735 19 26 2,929 3,330
Total banking businesses 1,074 424 3,802 3,991 22 864,567 68,053
Asset Management and Processing businesses
BlackRock 133 107 577 533 24 25 864 684
PFPC 65 36 817 846 31 17 1,888 1,771
Total asset management and processing 198 143 1,394 1,379 26 22 2,752 2,455
Total business results 1,272 567 5,196 5,370 23 10 67,319 70,508
Other (72) (190) 211 (440) (730) (74)
Results from continuing operations 1,200 377 5,407 4,930 19 666,589 70,434
Discontinued operations (16) 551
Results before cumulative effect of
accounting change 1,184 382 5,407 4,930 19 666,589 70,485
Cumulative effect of accounting change (5)
Total consolidated (b) $1,184 $377 $5,407 $4,930 19 6$66,589 $70,485
(a) Amounts for 2002 reflect, where applicable, the adoption, effective January 1, 2002, of the new accounting standard under which goodwill is no longer amortized to expense.
(b) Operating revenue is presented on a taxable-equivalent basis except for BlackRock and PFPC. Total consolidated operating revenues included in the table above exceeded total
operating revenues on a book basis for 2002 and 2001 by $13 million and $16 million, respectively, due to taxable-equivalent adjustments.
(c) Percentages for BlackRock reflect return on equity.