PNC Bank 2002 Annual Report Download - page 31
Download and view the complete annual report
Please find page 31 of the 2002 PNC Bank annual report below. You can navigate through the pages in the report by either clicking on the pages listed below, or by using the keyword search tool below to find specific information within the annual report.-
 1
1 -
2
-
3
-
4
-
5
-
6
-
7
-
8
-
9
-
10
-
11
-
12
-
13
-
14
-
15
-
16
-
17
-
18
-
19
-
20
-
 21
21 -
 22
22 -
 23
23 -
 24
24 -
 25
25 -
 26
26 -
 27
27 -
 28
28 -
 29
29 -
 30
30 -
 31
31 -
 32
32 -
 33
33 -
 34
34 -
 35
35 -
 36
36 -
 37
37 -
 38
38 -
 39
39 -
 40
40 -
 41
41 -
42
-
43
-
44
-
45
-
46
-
47
-
48
-
49
-
50
-
51
-
52
-
53
-
54
-
55
-
56
-
57
-
58
-
59
-
60
-
61
-
62
-
63
-
64
-
65
-
66
-
67
-
68
-
69
-
70
-
71
-
72
-
73
-
74
-
75
-
76
-
77
-
78
-
79
-
80
-
81
-
82
-
83
-
84
-
85
-
86
-
87
-
88
-
89
-
90
-
91
-
92
-
93
-
94
-
95
-
96
-
97
-
98
-
99
-
100
-
101
-
102
-
103
-
104
-
105
-
106
-
107
-
108
-
109
-
110
-
111
-
112
-
113
-
114
-
115
-
116
-
117
 |
 |
29
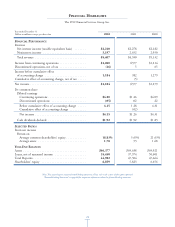
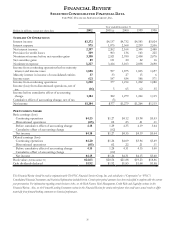
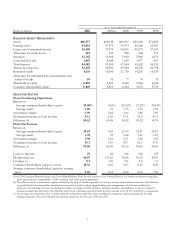
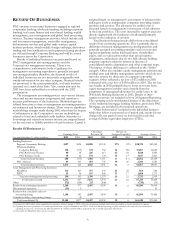
BALANCE SHEET HIGHLIGHTS
During 2002, the Corporation emphasized the growth and
retention of value-added transaction deposits while changing
the mix of earning assets, including a reduction of institutional
loans held for sale. These actions have resulted in a significant
risk repositioning of the Corporation as reflected in the
Consolidated Balance Sheet and Consolidated Average
Balance Sheet line items discussed below.
Total assets were $66.4 billion at December 31, 2002
compared with $69.6 billion at December 31, 2001. Average
interest earning assets were $55.3 billion in 2002, down $4.0
billion from 2001 due primarily to a decrease in average loans
that was partially offset by increases in average securities and
average loans held for sale.
Average loans for 2002 were $37.1 billion compared with
$44.8 billion in 2001, a decline of $7.7 billion or 17%. Loans
represented 67% of average interest-earning assets for 2002
compared with 76% for 2001. The decreases were primarily
due to a decline in residential mortgages and institutional
lending portfolios that more than offset an increase in PNC
Business Credit loans resulting from the acquisition in 2002 of
a portion of National Bank of Canada’s (“NBOC”) U.S. asset-
based lending business. The term “loans” in this report
excludes loans held for sale and securities that represent
interests in pools of loans.
Changes in loans held for sale are described in 2001
Strategic Repositioning and in Loans Held for Sale in the
Consolidated Balance Sheet Review section of this Financial
Review.
Average securities totaled $12.0 billion for 2002, an
increase of $1.1 billion from 2001. Securities comprised 22%
of average interest-earning assets for 2002 compared with 18%
for 2001. The increases were primarily due to net securities
purchases upon redeployment of funds resulting from loan
downsizing and interest rate risk management activities.
Funding cost is affected by the volume and composition of
funding sources as well as related rates paid thereon. Average
deposits comprised 66% of total sources of funds for 2002
compared with 64% for 2001, respectively, with the remainder
comprised primarily of wholesale funding obtained at
prevailing market rates.
Average interest-bearing demand and money market
deposits totaled $22.1 billion for 2002 compared with $21.3
billion in 2001. The increase reflected focused marketing
efforts to grow and maintain more valuable transaction
accounts while higher cost, less valuable retail certificates of
deposit were not emphasized. Average borrowed funds for
2002 decreased $2.8 billion, to $10.7 billion, compared with
2001 commensurate with the decline in average earning assets.
See the Consolidated Average Balance Sheet and Net Interest
Analysis for additional information.